When gold surged past $4,000 per ounce in October 2025, the precious metals market captured headlines worldwide. But when prices pulled back sharply to test support near $3,960 in early November, a familiar pattern emerged: investors who cheered the rally suddenly questioned whether it was over.
This psychological whiplash reveals a fundamental misunderstanding about how bull markets actually work. Every major long-term success story, whether it’s a transformative company, a breakthrough stock, or a commodity like gold, goes through periods of sharp corrections. These temporary declines aren’t signs of weakness, they’re normal, healthy features of strong bull markets that shake out impatient investors before prices eventually move higher again.
According to the World Gold Council’s Q3 2025 Gold Demand Trends report, gold demand reached a record 1,313 tonnes despite prices trading near all-time highs. This combination of record demand and record prices, rather than signaling a market top, demonstrates the structural strength underlying gold’s current bull market. Understanding why corrections happen and how to navigate them separates successful long-term investors from those who sell at precisely the wrong time.
The Anatomy of Bull Market Corrections
Bull markets don’t move in straight lines. They advance through a pattern of rallies and pullbacks, with each correction testing investor resolve before the next leg higher begins. This pattern has repeated consistently across every major gold bull market in modern history.
The 1970s Gold Bull Market: A Template for Understanding Corrections
The legendary 1970s gold bull market provides the clearest template for understanding how corrections function within larger uptrends. From 1971 to 1980, gold rose from $35 per ounce to an eventual peak of $850, delivering a staggering 2,329% return. But this wasn’t a smooth ascent.
In 1974, gold experienced a brutal 47% correction, plunging from $197 to $103 per ounce. The decline lasted nine months and triggered widespread declarations that the gold bull market had ended. Financial media proclaimed that the “gold bubble” had burst. Yet this correction merely represented a consolidation within a much larger uptrend. Gold subsequently recovered and ultimately surged to $850 by January 1980.
The 1974 correction wasn’t an anomaly. Throughout the 1970s bull market, gold experienced corrections exceeding 20% on five separate occasions. Each time, bearish sentiment intensified. Each time, investors who sold during the panic missed the subsequent rally. According to Federal Reserve historical data, the structural drivers supporting gold, persistent inflation, currency debasement, and geopolitical uncertainty, remained intact throughout these corrections.

The 2001-2011 Bull Market: Modern Precedent
Gold’s more recent bull market, spanning 2001 to 2011, followed a remarkably similar pattern. During this period, gold rose from approximately $250 per ounce to over $1,900, delivering returns exceeding 650%. But this rally featured numerous corrections that tested investor conviction.
In 2008, amid the financial crisis that would ultimately drive gold to new highs, the metal experienced a sharp 34% correction from $1,033 to $681. The selloff occurred as investors liquidated everything to raise cash during the credit crunch. Those who understood that corrections are normal within bull markets recognized this as a buying opportunity. Gold recovered quickly and reached $1,900 by 2011.
Throughout the 2001-2011 period, gold experienced corrections of 15-20% roughly once every 18-24 months. These pullbacks served a critical function: they cleared out overleveraged speculators, reset overbought technical conditions, and created entry points for new buyers who would support the next leg higher.
Why Corrections Are Necessary, Not Problematic
Market corrections serve several essential functions that actually strengthen long-term trends rather than undermining them:
Preventing Speculative Bubbles
When assets rise too far, too fast without corrections, they attract excessive speculation and leverage. This creates unstable conditions where a sudden decline triggers cascading liquidations. Regular corrections prevent this dynamic by periodically clearing out weak hands and resetting sentiment before speculative excess reaches dangerous levels.
As detailed in our analysis of why gold and silver defy technical overbought signals, the precious metals market in 2025 has experienced healthy pullbacks that prevented the kind of speculative mania that characterized previous bubble peaks.
Resetting Technical Conditions
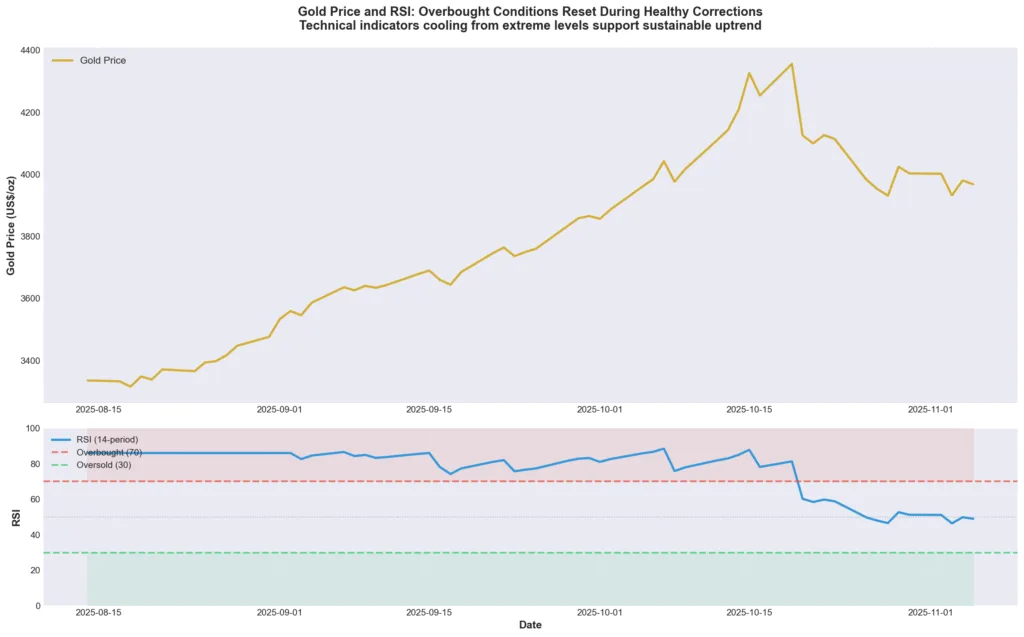
Technical indicators like the Relative Strength Index (RSI) become extremely overbought during extended rallies. Corrections allow these indicators to reset to levels where renewed buying can drive the next advance. When gold pulled back from October’s highs above $4,000, RSI readings that had reached extreme levels above 80 cooled to more sustainable ranges around 50-60.
This technical resetting doesn’t indicate fundamental weakness. Rather, it creates the conditions for sustainable advances rather than unsustainable spikes followed by crashes.
Creating Opportunity for Strategic Accumulation
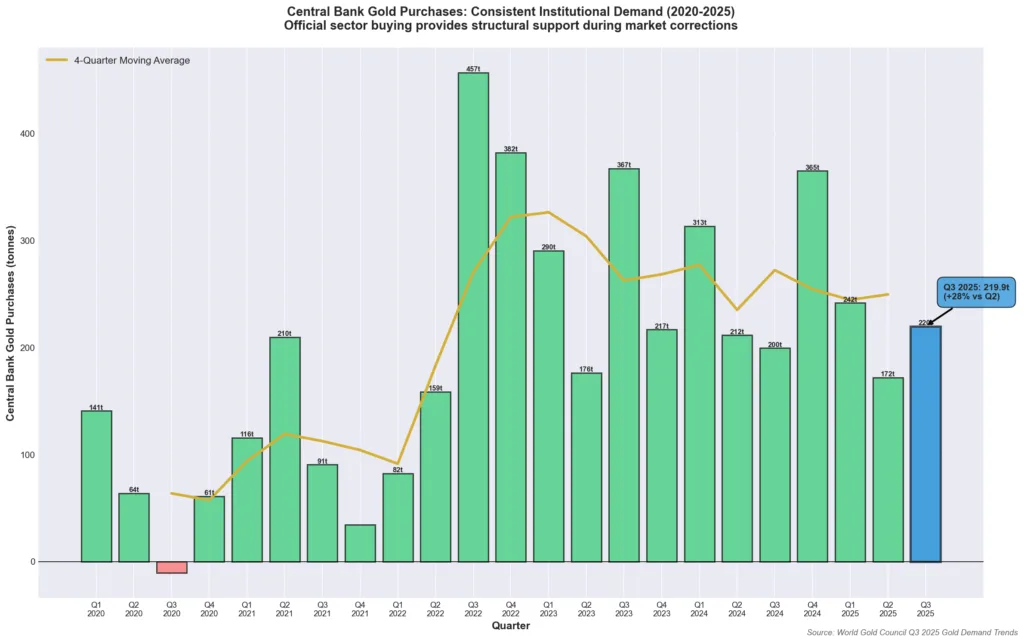
Long-term investors understand that corrections provide opportunities to add to positions at better prices. Central banks, the largest and most price-insensitive gold buyers, often increase accumulation during market pullbacks.
According to the World Gold Council, central banks purchased 219.9 tonnes of gold in Q3 2025, up 28% from Q2. This institutional buying accelerated during periods of price weakness, providing structural support that prevents corrections from turning into sustained bear markets.
The Current 2025 Correction in Context
Gold’s recent pullback from October highs above $4,355 per ounce to levels around $3,982 represents approximately an 8.5% correction. By historical standards of bull market corrections, this qualifies as relatively modest.
What Triggered the Latest Pullback?
Several technical and fundamental factors contributed to gold’s recent weakness:
Profit-Taking After Historic Gains: Gold gained more than 50% year-to-date through October 2025, according to Kitco market data. After such extraordinary gains, profit-taking becomes inevitable as early investors lock in returns.
Dollar Strength: The U.S. dollar experienced temporary strength in late October and early November, creating headwinds for dollar-denominated gold prices. When the dollar rises, it takes more dollars to buy the same ounce of gold, creating downward pressure on prices.
Technical Selling: Month-end portfolio rebalancing and options expiration created technical selling pressure that amplified the decline. Computerized trading algorithms triggered stop-loss orders at key technical levels, creating temporary dislocations.
Overbought Conditions: As explored in our previous analysis, gold and silver reached severely overbought technical conditions that typically precede short-term consolidations.
Critically, none of these factors represent fundamental changes to the structural drivers supporting gold. They’re technical and cyclical factors that create volatility within ongoing trends.
Fundamental Drivers Remain Intact
While technical factors drove the short-term correction, the fundamental case for gold has actually strengthened:
Central Bank Demand Accelerating: As discussed in our analysis of who’s buying all the gold in Q3 2025, official sector purchases remain elevated at 634 tonnes year-to-date through Q3. This represents permanent demand that doesn’t reverse with short-term price fluctuations.
Investment Demand Surging: Gold-backed ETFs attracted record inflows of $17 billion in September 2025 alone, demonstrating institutional conviction despite elevated prices. These flows continued even during October’s correction, suggesting strategic buyers view weakness as opportunity.
Supply Constraints Persisting: Mine production growth remains anemic at just 2% year-over-year despite record prices above $4,000 per ounce. The structural inability of supply to respond to price increases provides fundamental support during corrections.
Monetary Conditions Favorable: Real interest rates, after accounting for inflation, remain compressed. The Federal Reserve began cutting interest rates in late October 2025, marking the start of its easing cycle as inflation persists above the 2% target. This combination of easing monetary policy and sticky inflation historically supports gold appreciation.
How Successful Investors Navigate Corrections
Understanding that corrections are normal doesn’t eliminate the emotional challenge of watching portfolio values fluctuate. However, investors who successfully navigate bull markets employ specific strategies:
Maintain Long-Term Perspective
The most successful gold investors think in terms of years, not months. They recognize that short-term volatility is the price paid for long-term appreciation. As examined in our analysis of the gold structural bull market, the fundamental drivers supporting higher prices operate over multi-year timeframes.
This perspective allows investors to view corrections as normal rather than threatening. When Amazon stock declined 95% during the 2000-2002 bear market, investors with conviction in the company’s long-term prospects accumulated shares at bargain prices. Those who sold during the panic missed one of history’s greatest wealth-creation stories.
Use Dollar-Cost Averaging
Rather than attempting to time perfect entries, systematic accumulation through dollar-cost averaging removes emotion from the equation. Making regular purchases regardless of price ensures exposure to long-term trends while automatically buying more during corrections and less during rallies.
For investors building precious metals positions within retirement accounts, dollar-cost averaging provides a disciplined approach that captures the full cycle of bull market volatility.
Size Positions Appropriately
Proper position sizing determines whether investors can maintain holdings through corrections or panic at the worst possible time. Conventional wisdom suggests precious metals allocations of 5-15% of investable assets for most investors, though specific circumstances vary.
When positions are sized appropriately, even sharp corrections don’t threaten overall portfolio stability. This allows investors to maintain conviction during temporary weakness rather than being forced to sell at losses.
Focus on Physical Holdings
Investors holding physical gold in coins and bars often navigate corrections more successfully than those with paper positions. Physical metals don’t display minute-by-minute price fluctuations, reducing the psychological impact of volatility.
Moreover, physical gold carries no counterparty risk, the metal retains value regardless of any institution’s solvency. During periods of financial stress, this characteristic becomes particularly valuable.
Historical Precedents: What Happened After Previous Corrections
Examining what happened after previous corrections during gold bull markets provides valuable perspective:
After the 1974 correction (47% decline): Gold recovered and ultimately gained 734% over the next six years, reaching $850 by January 1980.
After the 2008 correction (34% decline): Gold recovered within months and gained 178% over the next three years, reaching $1,900 by 2011.
After the October 2020 correction (19% decline): Gold consolidated through early 2021 before beginning the rally that would eventually lead to the 2025 highs above $4,000.
The consistent pattern across these episodes shows that corrections within bull markets, while psychologically difficult, represent temporary setbacks rather than trend changes. Investors who sold during these corrections invariably regretted those decisions as prices subsequently surged to new highs.
What Could End the Bull Market
Understanding what would actually end gold’s bull market helps distinguish normal corrections from fundamental trend changes:
Credible Fiscal Discipline: If governments demonstrated commitment to balanced budgets and debt reduction, reducing concerns about currency debasement, gold’s fundamental case would weaken. Current trajectory suggests this remains unlikely, with the U.S. national debt exceeding $38 trillion and growing.
Sustained High Real Yields: If real interest rates (nominal rates minus inflation) rose above 3-4% and remained elevated for extended periods, gold would face structural headwinds. Current conditions show real yields compressed below 2% with the Fed in easing mode.
Resolution of Geopolitical Tensions: Reduced global uncertainty would diminish gold’s safe-haven appeal. Present conditions suggest geopolitical risks remain elevated across multiple regions.
Central Bank Selling: If central banks began liquidating gold reserves rather than accumulating, it would signal fundamental shift. Current data shows accelerating official sector buying rather than selling.
None of these conditions currently exist, suggesting the structural bull market remains intact despite short-term corrections.
Practical Implications for Investors Today
For investors navigating the current environment in November 2025:
View Weakness as Opportunity: If fundamental conviction in gold remains sound, corrections provide opportunities to establish or add to positions at better prices than prevailed at October’s highs.
Avoid Leveraged Positions: Leverage amplifies volatility and forces liquidation at the worst times. Outright ownership of physical metals or conservative ETF positions allows weathering corrections without forced selling.
Diversify Across Metals: While gold provides the primary focus, platinum and palladium offer diversification within precious metals, while silver provides leverage to gold moves with additional industrial demand drivers.
Maintain Realistic Expectations: Bull markets feature corrections of 10-20% roughly once or twice per year. Expecting smooth linear gains sets investors up for disappointment and poor decision-making during inevitable volatility.
Conclusion: Corrections Test Conviction, Bull Markets Reward Patience
Every major success story in investing features periods where prices decline sharply, testing investor conviction. Amazon fell 95% from 1999 to 2001. Apple declined 82% from 1999 to 2003. Gold dropped 47% in 1974 and 34% in 2008. In each case, investors who understood these corrections as normal features of long-term trends, rather than catastrophic failures, positioned themselves for extraordinary wealth creation.
Gold’s current bull market, driven by unprecedented monetary expansion, unsustainable fiscal deficits, and structural shifts in central bank behavior, features similar characteristics. The October 2025 correction from $4,355 to current levels near $3,982 represents normal volatility within an ongoing trend rather than a fundamental reversal.
As highlighted in our analysis of the October 2025 gold price correction, pullbacks create healthier market structures and opportunities for strategic accumulation. Investors who maintain conviction in fundamental drivers while sizing positions appropriately can navigate these corrections successfully.
Whether you’re establishing initial precious metals positions or expanding existing holdings, Bullion Trading LLC offers comprehensive gold and silver solutions backed by market expertise. From popular sovereign coins like American Gold Eagles to large institutional bars, our extensive inventory serves every investment strategy. With gold demonstrating that corrections remain normal and healthy features of strong bull markets, now represents an opportunity for patient investors to build positions for the long term.