
American household debt just reached a sobering milestone: $18.59 trillion in Q3 2025, according to the New York Federal Reserve’s Household Debt and Credit Report. This represents a quarterly jump of $147 billion and marks a new all-time high. These aren’t just abstract numbers, they represent the foundation of the U.S. economy cracking under unprecedented financial pressure.
With two-thirds of GDP dependent on consumer spending, and American consumers now maxed out on debt across mortgages, credit cards, auto loans, and student debt, the economic implications extend far beyond household balance sheets. Manufacturing has contracted for eight consecutive months. Corporate debt burdens are climbing. Government deficits continue expanding. The entire economic system is drowning in a sea of debt accumulated since the pandemic.
When consumers who drive 68% of economic activity face mounting debt burdens, declining discretionary income, and rising delinquency rates, the ripple effects touch every asset class. This environment, characterized by systemic financial stress and persistent inflationary pressures, creates textbook conditions for gold appreciation. Understanding why requires examining not just the numbers, but what they reveal about the American economy’s structural vulnerabilities.
The Debt Breakdown: $18.59 Trillion and Climbing
Mortgages: The $13 Trillion Anchor
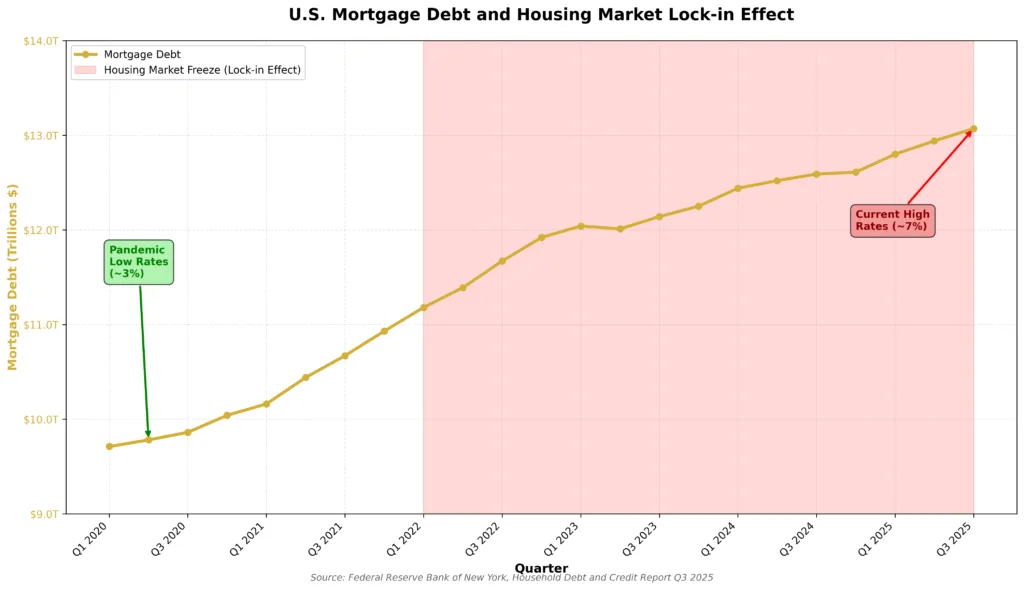
Mortgage debt comprises the bulk of household obligations at approximately $13 trillion. But the housing market has effectively frozen. Homeowners with 3% mortgages locked in during 2020-2021 refuse to sell, knowing they’d face 7%+ rates on new purchases. This creates a “lock-in effect” that paralyzes the housing market.
According to Federal Reserve housing data, existing home sales have plummeted to levels not seen since 2008, while home prices remain elevated. This combination, high debt levels, frozen liquidity, and asset prices disconnected from affordability, mirrors conditions preceding previous financial crises.
Younger buyers face particular hardship. The median home price relative to median income has reached historic extremes, effectively locking out first-time buyers. This demographic reality creates long-term headwinds for consumption, as household formation drives significant spending on furniture, appliances, and services.
Student Debt: $1.65 Trillion and 10% Delinquent
Student loan debt stands at $1.65 trillion, with nearly 10% of loans at least 90 days delinquent. Despite payment pauses during the pandemic, delinquency rates have climbed as borrowers resume payments in an environment of elevated inflation and slowing wage growth.
The Federal Reserve Bank of New York data shows that student debt delinquencies disproportionately affect younger borrowers who should be entering their prime earning and spending years. Instead, they’re diverting income to debt service rather than consumption or investment.
This isn’t just a microeconomic problem affecting individual borrowers, it’s a macroeconomic headwind. The cohort burdened by student debt represents the future consumer base. Their constrained purchasing power today translates to reduced economic growth tomorrow.
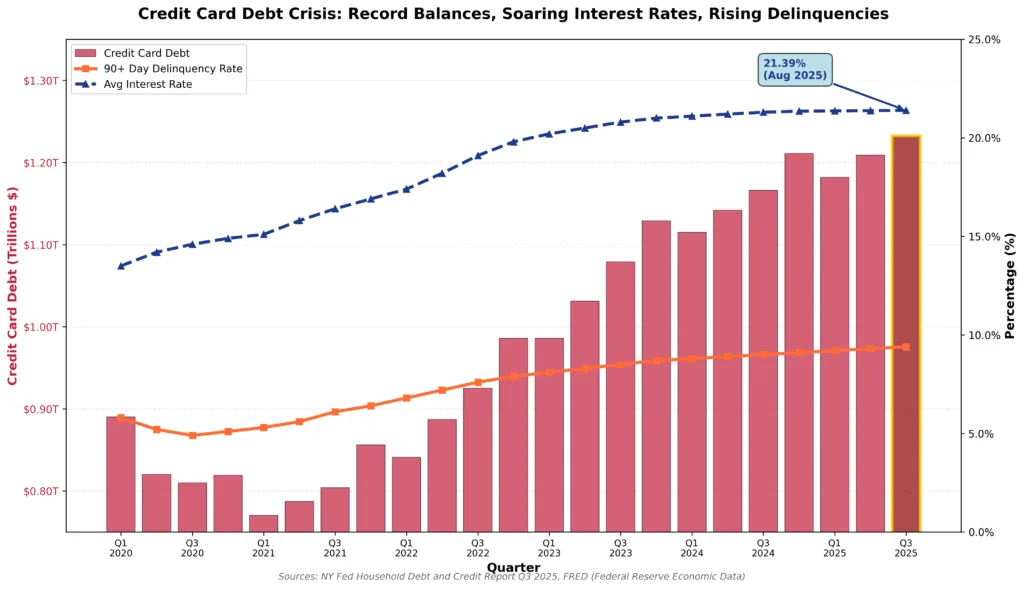
Credit Cards: $1.23 Trillion at Record Highs
Credit card debt hit a record $1.23 trillion in Q3 2025, up $24 billion from the previous quarter alone. With average credit card interest rates reaching 21.39% as of August 2025 according to Federal Reserve data, consumers are paying approximately $263 billion annually just in credit card interest, a direct wealth transfer from households to financial institutions.
This represents a staggering drain on purchasing power. Every dollar paid in interest is a dollar not spent on goods and services that drive economic growth. As credit card balances climb while real incomes stagnate, the debt service burden compounds, creating a vicious cycle that constrains consumer spending capacity.
Delinquency rates on credit cards have begun rising after years of artificially low levels during the pandemic. According to the New York Fed, serious delinquency rates (90+ days past due) on credit cards are approaching pre-pandemic levels. This early-stage stress signal typically precedes broader economic deterioration.
Auto Loans and Other Consumer Debt
Auto loan balances exceed $1.6 trillion, with delinquency rates climbing particularly among subprime borrowers. The combination of elevated vehicle prices (up more than 40% since 2020) and higher interest rates creates affordability challenges that manifest in rising defaults.
Other consumer debt categories, personal loans, retail credit, home equity lines, add approximately $500 billion to household obligations. Across every category, the pattern repeats: elevated debt levels, rising interest costs, and increasing delinquency rates.
Why This Debt Crisis Matters for Gold Investors
The Consumer Spending Trap
When households allocate increasing portions of income to debt service, consumption necessarily declines. The Bureau of Economic Analysis personal consumption data shows that consumers are spending more but getting less, real (inflation-adjusted) spending growth has dramatically slowed.
This creates a dangerous feedback loop: consumer weakness leads to business revenue pressure, which leads to employment cutbacks, which further weakens consumer spending. During previous episodes featuring similar dynamics, 1970s stagflation, 2008 financial crisis, gold substantially outperformed traditional financial assets.
Manufacturing Contraction: The Canary in the Coal Mine
The manufacturing sector has contracted for eight consecutive months according to the ISM Manufacturing Index. Manufacturing, while comprising only 11% of GDP, serves as a leading indicator for broader economic health.
Manufacturing contraction typically precedes consumer sector weakness by 6-12 months. When factories reduce production, they cut hours and employment, which reduces household income, which weakens consumption. This cycle, once begun, proves difficult to arrest without significant policy intervention.
The Policy Response Dilemma
Policymakers face an impossible choice: raising interest rates to combat inflation increases debt service burdens and accelerates defaults, while cutting rates to support growth risks reigniting inflation. This policy box mirrors the 1970s stagflation period when the Federal Reserve under Arthur Burns alternated between fighting inflation and supporting growth, ultimately failing at both.
During the original stagflation period (1966-1982), traditional portfolios suffered devastating losses. Stocks delivered essentially zero real returns across 16 years. Bonds were destroyed as rising interest rates crushed principal values. Meanwhile, gold surged from $35 per ounce to over $850, delivering returns exceeding 2,300%.

As examined in our analysis of AI job displacement and gold, today’s economy faces additional structural pressures from technological unemployment that create stagflationary conditions through different mechanisms than the 1970s, but with remarkably similar implications for gold.
Historical Precedent: Debt Crises and Gold Performance
The 2008 Financial Crisis Playbook
The 2008 financial crisis originated in household debt, specifically subprime mortgages. When housing prices declined and adjustable-rate mortgages reset to higher payments, defaults cascaded through the financial system. The crisis that began in household balance sheets ultimately threatened the entire global financial system.
Gold’s response proved instructive. After an initial sharp decline during the acute liquidity crisis (when institutions sold everything to raise cash), gold recovered quickly and ultimately surged to new all-time highs above $1,900 by 2011. This represented a gain of approximately 165% from the October 2008 low.
The pattern followed a clear sequence: debt crisis → financial system stress → policy response (zero rates, quantitative easing) → currency debasement → gold appreciation. As detailed in our examination of gold as a liquidity crisis indicator, gold’s initial weakness during acute crisis phases typically precedes sustained appreciation once monetary responses begin debasing currencies.
The 1970s Stagflation: The Perfect Storm
The 1970s featured a toxic combination: slowing growth, rising inflation, and mounting debt burdens. Real wages stagnated despite nominal wage increases because inflation ran ahead of earnings. Debt levels climbed as households borrowed to maintain living standards.
This environment proved catastrophic for traditional portfolios. The Dow Jones Industrial Average trading in 1982 sat below its 1966 peak in nominal terms and had lost more than 60% of purchasing power after inflation. Bond investors suffered even worse losses as rising interest rates destroyed principal values.
Gold, meanwhile, delivered its most spectacular bull market in modern history. From $35 per ounce in August 1971 to over $850 by January 1980, gold provided the only reliable portfolio protection during an extended period of financial repression.
Current conditions mirror key elements of that era: persistent inflation above policy targets, slowing economic growth, mounting debt burdens across household and government sectors, and a Federal Reserve caught between fighting inflation and supporting growth.
Why Gold Provides Optimal Protection
No Counterparty Risk
Gold’s most critical attribute during periods of financial system stress is its nature as a physical asset with zero counterparty risk. Unlike stocks, bonds, or bank deposits, physical gold ownership doesn’t depend on any institution’s solvency, government’s stability, or corporation’s viability.
When household debt crises create banking instability, through mortgage defaults, credit card charge-offs, or auto loan delinquencies, gold maintains value independent of these institutional failures. The 2023 regional banking crisis demonstrated this principle when Silicon Valley Bank and others failed within weeks while gold surged as investors sought assets outside the banking system.
Fixed Supply Versus Unlimited Debt Creation
Gold’s supply increases approximately 1.5% annually through mining, a rate that has remained stable for decades and cannot be accelerated regardless of price. This contrasts sharply with debt, which can be created in unlimited quantities through credit expansion.
Total debt, household, corporate, and government combined, has increased by more than $4.4 trillion since the pandemic. This debt doesn’t represent real wealth creation; it represents claims on future production. When those claims exceed the economy’s capacity to produce, the adjustment occurs through either defaults (deflationary) or currency debasement (inflationary).
Historically, governments facing this choice overwhelmingly select inflation over deflation. The U.S. national debt exceeding $38 trillion (approximately 125% of GDP) creates powerful structural incentives for inflationary policy. Gold’s fixed supply makes it the natural beneficiary of this dynamic.
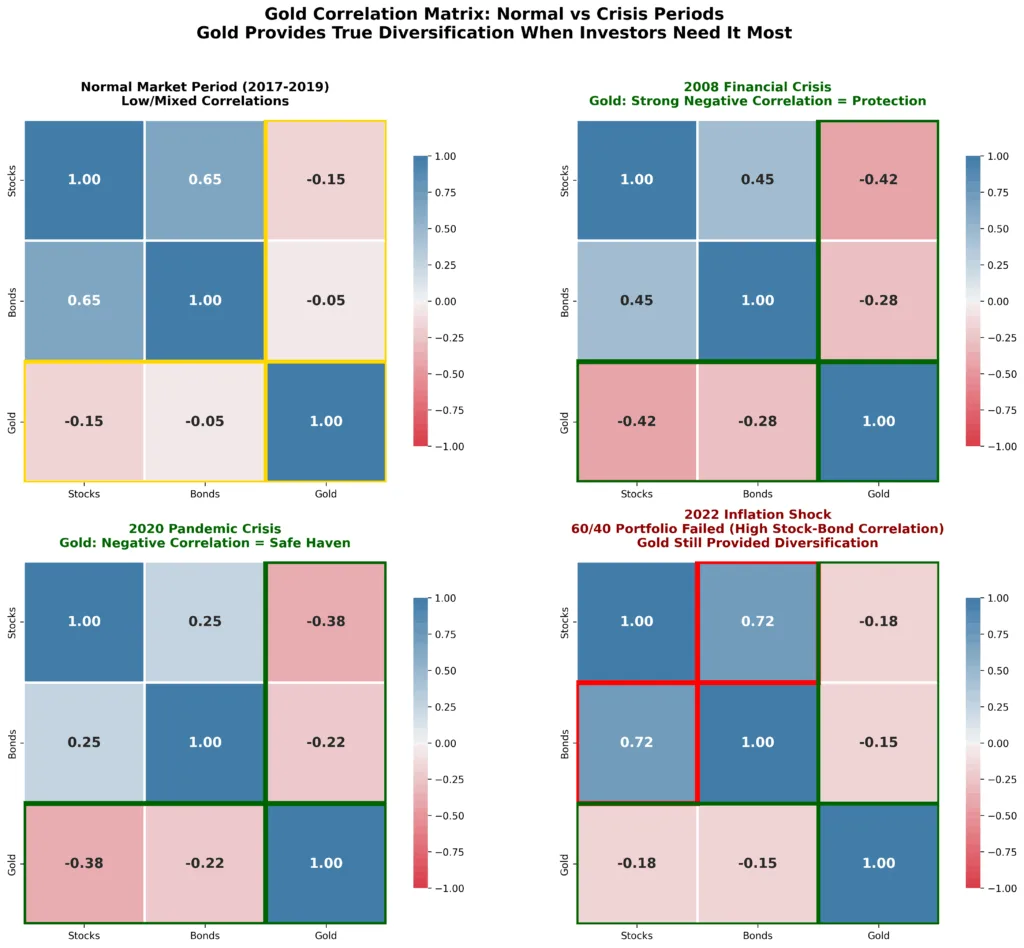
Portfolio Diversification During Correlated Declines
World Gold Council research demonstrates that gold’s correlation with stocks and bonds decreases precisely when investors need diversification most. During periods of financial stress, when equities decline and bonds fail to provide offsetting gains, gold typically appreciates.
This characteristic becomes particularly valuable as household debt stress threatens simultaneous pressure on both equity valuations (through reduced consumer spending impacting corporate earnings) and bond prices (through inflation forcing interest rate increases).
Central Banks Signal Long-Term Conviction
Perhaps the most significant validation of gold’s role comes from central bank behavior. According to World Gold Council Q3 2025 data, central banks purchased 219.9 tonnes of gold in Q3 2025, up 28% from Q2. Year-to-date through Q3, central banks accumulated 634 tonnes.
As examined in our analysis of who’s buying all the gold, this represents the third consecutive year of purchases exceeding 1,000 tonnes annually, unprecedented in the modern era. Central banks are diversifying away from dollar-heavy reserves for reasons directly related to household debt dynamics: currency debasement concerns, fiscal sustainability questions, and systemic risk hedging.
When the world’s most sophisticated reserve managers aggressively accumulate gold at record prices amid mounting household and government debt levels, individual investors should pay attention. These institutions possess confidential financial system data and operate with multi-decade time horizons. Their sustained accumulation at elevated prices signals profound concern about the long-term stability of fiat currency systems.
The Gold Investment Case Strengthens
Investment Demand Surging
According to World Gold Council data, investment demand reached 537 tonnes in Q3 2025, up 47% year-over-year. This includes both physical bar and coin demand (315 tonnes) and dramatic ETF inflows (222 tonnes).
Gold-backed ETFs experienced their largest monthly inflow ever in September 2025, totaling $17 billion. These flows continued even during October’s price correction, suggesting institutional investors view weakness as opportunity rather than trend change.
The divergence between retail sentiment and institutional behavior reveals important market dynamics. While price-sensitive retail jewelry consumers reduced purchases as gold traded above $4,000 per ounce, price-insensitive institutional buyers, central banks, pension funds, sovereign wealth funds, accelerated accumulation.
This pattern mirrors other successful long-term investments: when sophisticated buyers with deep analytical resources accumulate aggressively at elevated prices, they’re responding to fundamental drivers rather than speculating on short-term momentum.
Supply Constraints Persist
Despite gold trading at record highs above $4,000 per ounce in October 2025, mine production grew only 2% year-over-year according to World Gold Council supply data. Several structural factors constrain production growth:
- Declining ore grades: Average gold ore grades have declined significantly, meaning miners must process more ore to extract the same amount of gold
- Extended development timelines: From discovery to production, new gold mines require 7-15 years due to permitting and environmental reviews
- Capital intensity: Lower ore grades and deeper deposits require larger, more expensive mining operations
- Geopolitical risk: Many high-potential deposits exist in unstable regions, deterring investment
These constraints mean supply cannot rapidly respond to demand surges. With central banks and institutional investors absorbing more than 60% of global annual mine production, and doing so at record prices without hesitation, the supply-demand imbalance supports sustained price appreciation over multi-year timeframes.
Conclusion: Preparing Portfolios for Debt-Driven Disruption
American household debt reaching $18.59 trillion represents more than a statistical milestone, it signals fundamental economic vulnerabilities with profound implications for asset allocation. With consumer spending driving two-thirds of GDP, and American consumers now maxed out on debt while facing rising delinquencies, the ripple effects will touch every sector of the economy.
The combination of record debt levels, slowing growth, persistent inflation, and limited policy options creates textbook conditions for the stagflationary environment where gold historically outperforms traditional financial assets. Historical precedent from both the 1970s and 2008 demonstrates gold’s capacity to preserve purchasing power during periods when debt crises generate financial system stress and monetary policy responses debase currencies.
Gold doesn’t represent speculation on short-term price movements or a bet on economic collapse. Rather, it serves as strategic insurance against purchasing power erosion and systemic risks created when household, corporate, and government debt levels reach unsustainable levels. When central banks worldwide demonstrate through record accumulation that those with the longest time horizons and best information understand gold’s essential role, individual investors should pay attention.
Whether you’re establishing initial precious metals positions or expanding existing holdings, Bullion Trading LLC offers comprehensive precious metals solutions backed by market expertise and commitment to investor education. From popular sovereign coins to large institutional bars, our extensive inventory serves every investment strategy. In an economy where household debt has reached unprecedented levels and policy options narrow with each passing quarter, gold ensures your wealth remains protected regardless of which way the debt crisis ultimately resolves.