When tanks roll across borders or missiles light up the night sky, one of the first things investors do is check the price of gold. It is almost reflexive at this point. The logic feels simple: war creates uncertainty, uncertainty creates fear, and fear sends money into gold. But the actual relationship between military conflicts and gold prices is more nuanced than most people realize. Sometimes gold surges before the first shot is fired and then falls once fighting begins. Other times, it barely moves at all. And in rare cases, like the prolonged geopolitical tensions involving Iran from 2024 into 2026, gold enters an entirely different orbit.
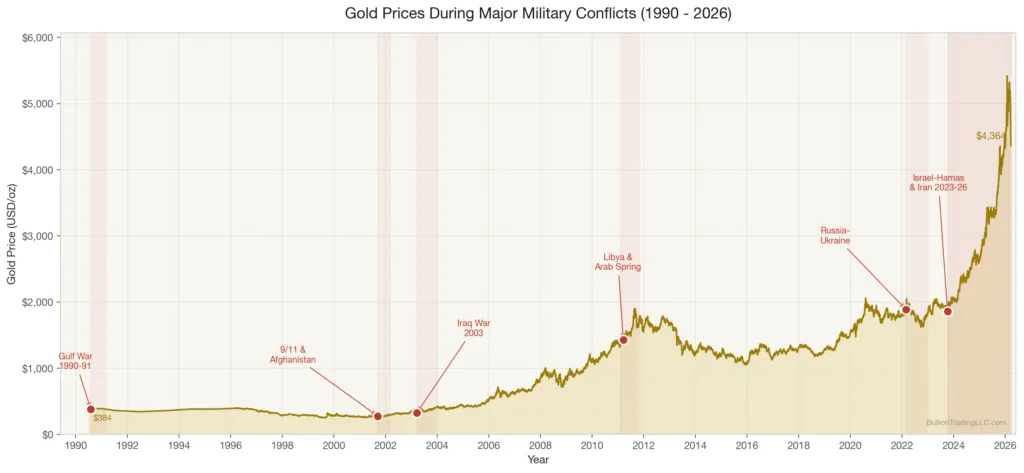
This article traces gold’s behavior during every major military conflict since 1990, using verified price data and historical records. Understanding these patterns matters because we are living through one of the most geopolitically complex periods in modern history, with gold sitting above $4,400 per ounce as of March 2026.
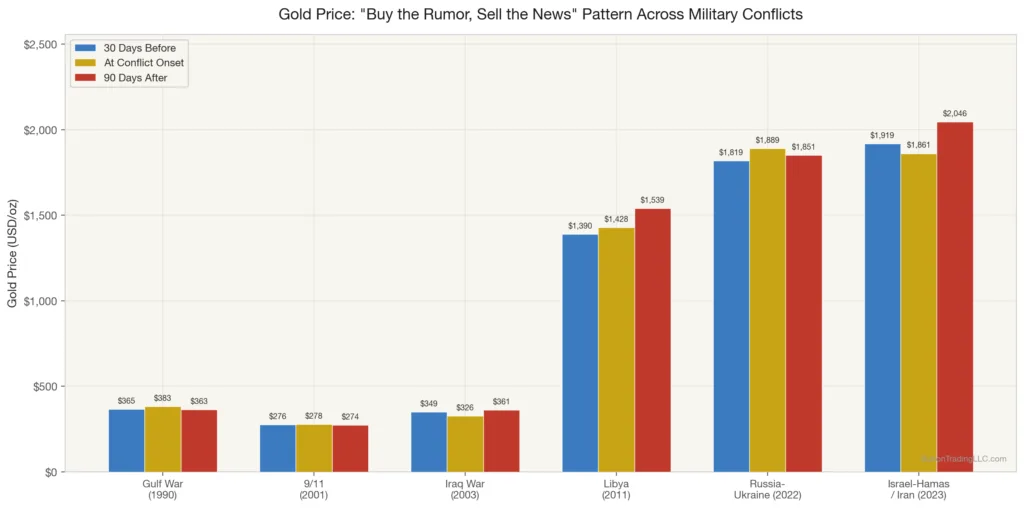
The Gulf War (1990-1991): The Original “Buy the Rumor, Sell the News”
On August 2, 1990, Iraqi forces invaded Kuwait, and the gold market responded immediately. Gold had been trading around $365 per ounce in late July. Within weeks of Iraq’s invasion, the price climbed to approximately $414 per ounce by early October 1990, representing a gain of roughly 13% in two months. The surge made sense: the world’s major oil-producing region was in crisis, and nobody knew whether Saddam Hussein would stop at Kuwait or push into Saudi Arabia.
What happened next, though, became a textbook lesson for gold traders. When the U.S.-led coalition launched Operation Desert Storm on January 17, 1991, gold did not rally further. It fell. By the end of February 1991, when the ground war wrapped up in just 100 hours, gold had retreated to around $363 per ounce, essentially giving back all of its invasion gains. The conflict was swift, decisive, and resolved the uncertainty that had been propping up gold prices.
This pattern, where gold rises on the threat of conflict and declines once the actual fighting starts, became known as the “buy the rumor, sell the news” dynamic. It would repeat itself in different forms over the following decades.
September 11 and the Afghanistan War (2001): A Muted Response That Surprised Many
Gold was in a long secular bear market when the September 11 attacks happened. On September 10, 2001, gold closed at roughly $271 per ounce. After the attacks, the New York Stock Exchange and COMEX both closed for four trading days. When markets reopened on September 17, gold spiked to approximately $287 per ounce.
The U.S. invasion of Afghanistan began on October 7, 2001, but gold’s response was surprisingly muted. By year-end 2001, gold was trading around $276 per ounce. The modest reaction reflected several realities of that moment: the Afghan campaign moved quickly, the Federal Reserve slashed interest rates aggressively to support the economy, and the dollar remained strong as global capital flowed into U.S. assets as a different kind of safe haven. In retrospect, 9/11 planted the seeds for gold’s massive bull run that would begin in earnest over the following years, but the immediate price reaction was far smaller than most people remember.
The Iraq War (2003): Another Classic “Sell the News” Event
The build-up to the Iraq War offers one of the cleanest examples of how gold behaves when a military conflict is widely telegraphed. Throughout late 2002, as the Bush administration made its case for invading Iraq, gold climbed steadily from around $320 per ounce in October 2002 to approximately $388 per ounce by early February 2003. That represented a gain of more than 20% in just four months, driven almost entirely by war premium.
Then, as the diplomatic process at the United Nations collapsed and it became clear that invasion was inevitable, gold started pulling back. By the time U.S. forces crossed the Iraqi border on March 20, 2003, gold was already back around $340 per ounce. Investors had priced in the conflict and moved on. The early military success reinforced the sell-off, and gold didn’t reclaim its February 2003 highs until later that year when other fundamental factors, including dollar weakness, took over as the primary drivers.
The Iraq War also demonstrated something important about gold and prolonged conflict: the initial price reaction fades, but if the war creates lasting economic consequences like higher oil prices, fiscal deficits, or currency debasement, gold eventually responds to those secondary effects. The Iraq War’s long-term cost, estimated at over $2 trillion by Brown University’s Costs of War Project, contributed to the fiscal deterioration that helped fuel gold’s rally from $400 in 2004 to $1,000 by 2008.
Libya and the Arab Spring (2011): Gold Rides a Wave of Regional Chaos
The Libyan conflict is harder to isolate because it occurred during a period of overlapping crises. Gold started 2011 at around $1,420 per ounce, already deep into a bull market that had been running since 2001. When NATO began its military intervention in Libya in March 2011, gold was trading near $1,430 per ounce. The Libyan situation alone was not the primary driver, but it added to a broader sense of Middle Eastern instability during the Arab Spring, when protests and regime changes swept across Tunisia, Egypt, Yemen, Bahrain, and Syria.
By September 2011, gold reached a then-record high of approximately $1,921 per ounce. However, attributing that move solely to Libya or any single conflict would be misleading. The European sovereign debt crisis was intensifying, with serious concerns about Greek, Portuguese, and Italian government bonds. Standard & Poor’s had just downgraded the U.S. credit rating for the first time in history. And the Federal Reserve was deep into quantitative easing. Gold was responding to all of these factors simultaneously.
The Libya episode teaches an important lesson: during periods of overlapping crises, gold becomes what traders call a “fear aggregator.” Each individual event might not move gold much on its own, but the cumulative effect of multiple concurrent crises creates a compounding demand for safe-haven assets.
The Russia-Ukraine War (2022): A Geopolitical Shock With a Familiar Pattern
Russia’s full-scale invasion of Ukraine on February 24, 2022, was the largest conventional military operation in Europe since World War II. Gold was trading around $1,900 per ounce before the invasion. Within two weeks, gold surged to approximately $2,070 per ounce by March 8, 2022, a gain of roughly 9%.
But once again, the initial surge was followed by a retreat. By mid-April 2022, gold had pulled back to around $1,930 per ounce as markets digested the reality that the conflict, while devastating for Ukraine, was unlikely to spread into a broader NATO-Russia war. The sanctions on Russia, while unprecedented, were known quantities by that point. The Federal Reserve was also beginning an aggressive rate-hiking cycle, which historically puts downward pressure on non-yielding assets like gold.
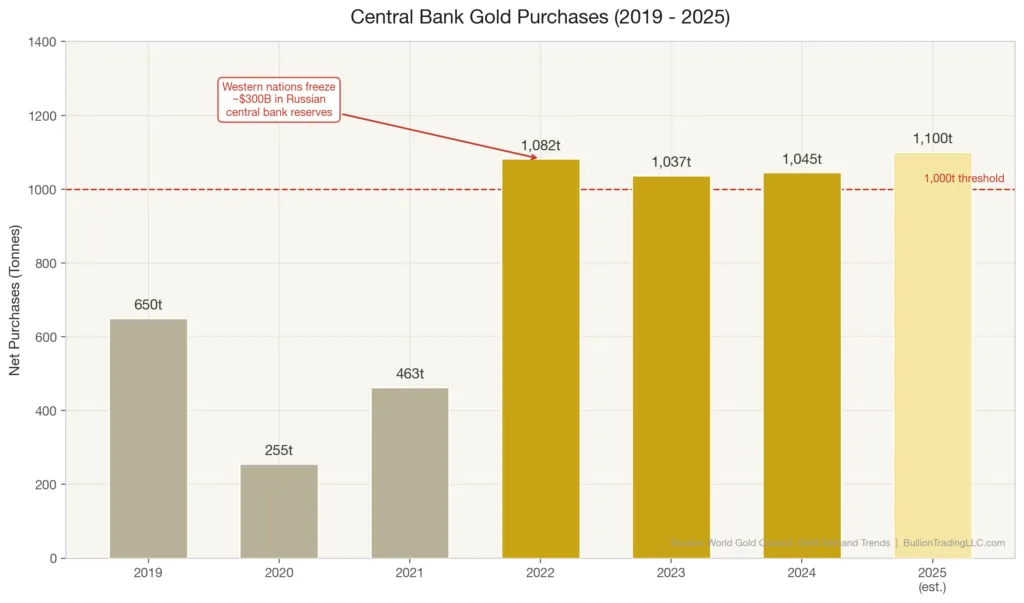
The Russia-Ukraine conflict’s more lasting impact on gold came through indirect channels. The freezing of roughly $300 billion in Russian central bank reserves by Western nations sent a powerful signal to central banks worldwide: sovereign reserves held in dollars and euros could be weaponized. This realization fueled a dramatic acceleration in central bank gold purchases. According to the World Gold Council, central banks bought over 1,000 tonnes of gold in 2022, 2023, and 2024, three consecutive years of extraordinary accumulation. That structural shift has been a far more powerful driver of gold prices than the initial wartime spike.
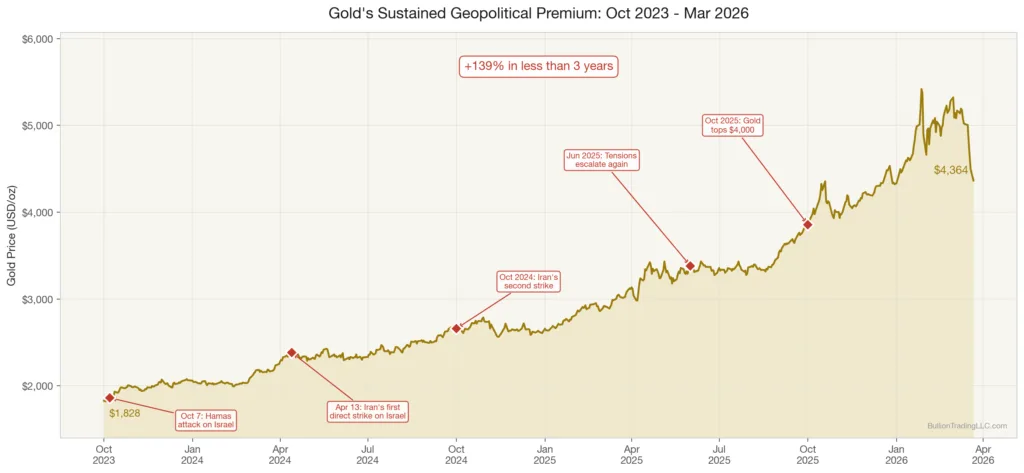
Israel-Hamas and the Escalation With Iran (2023-2026): Gold Enters a New Era
The October 7, 2023 Hamas attack on Israel and the ensuing military response in Gaza set in motion a chain of geopolitical escalations that have fundamentally reshaped the gold market. Gold was trading around $1,830 per ounce in early October 2023. By late October, it had crossed $2,000 per ounce as investors assessed the risk of a wider regional war.
The escalation that mattered most came in April 2024, when Iran launched its first-ever direct military strike on Israeli territory using drones and ballistic missiles. This was a threshold moment. For decades, Iran and Israel had engaged in shadow conflicts through proxies. A direct state-to-state military exchange between two of the Middle East’s most powerful militaries introduced a risk premium that gold had not carried since the Cold War. Gold surged past $2,300 per ounce during the April escalation and, according to the World Gold Council, the LBMA gold price set 40 new record highs during 2024, ending the year with an average price of $2,386 per ounce, a 23% gain.
Unlike previous conflicts where gold spiked and then retreated, the Iran-related tensions have created what appears to be a sustained geopolitical premium. The ongoing confrontation between Iran and Israel, combined with Houthi attacks on Red Sea shipping, instability in Syria, and the broader reshaping of Middle Eastern alliances, has kept safe-haven demand persistently elevated. By Q3 2025, the World Gold Council’s Gold Demand Trends report showed the average quarterly gold price had reached $3,456 per ounce, up 40% year-over-year, with total quarterly demand hitting a record 1,313 tonnes.
As of March 23, 2026, gold trades above $4,400 per ounce. The Iran-related geopolitical premium is just one component of a broader story that includes record central bank buying, massive ETF inflows, U.S. fiscal concerns, and a global economic environment where multiple risk factors are converging simultaneously.
Why the “Buy the Rumor, Sell the News” Pattern Is Breaking Down
For most of the period from 1990 to 2022, gold followed a relatively predictable pattern around military conflicts. Prices would rise on fear and uncertainty, then fall once the actual fighting began and outcomes became clearer. The Gulf War, the Iraq War, and even the initial phase of the Russia-Ukraine war all followed this template.
Something different is happening now. The geopolitical landscape of 2024 through 2026 is characterized by simultaneous, unresolved conflicts rather than discrete military events with clear beginnings and endings. The Russia-Ukraine war has no resolution in sight. Iran-Israel tensions continue to simmer with periodic escalations. Taiwan Strait concerns linger. And these geopolitical risks are layered on top of structural economic factors like unprecedented government debt levels, persistent inflation, and central banks actively diversifying away from dollar reserves.
This convergence of factors explains why gold has not experienced the typical post-conflict retreat. There is no single “all clear” signal to sell into. Each new geopolitical development reinforces the case for holding gold as portfolio insurance, and the market is pricing that reality accordingly.
What This History Means for Investors Today
Looking across 35 years of military conflicts and gold price data, several patterns stand out. Short, decisive military operations tend to produce temporary gold spikes that quickly reverse. Telegraphed conflicts, like the 2003 Iraq invasion, often see gold peak before the fighting starts. But prolonged, multi-front geopolitical tensions, especially those involving major powers or critical resource regions, create a durable gold premium that can persist for years.
For investors evaluating gold in the current environment, the key insight is that today’s geopolitical premium is not built on a single conflict that might resolve next month. It is built on a structural shift in how nations manage risk, how central banks allocate reserves, and how investors perceive the stability of the global order. The World Gold Council reports that total gold demand reached a record 4,974 tonnes in 2024, with central banks purchasing over 1,000 tonnes for the third consecutive year.
History suggests that the best time to establish or add to gold positions is before geopolitical tensions escalate, not after. Investors who bought gold when the Gulf War fears were building in August 1990, or when the Iran-Israel dynamic shifted in early 2024, captured the war premium before it was fully priced in. Those who chased prices after the fact often bought at temporary peaks.
Whether you are looking to build a strategic position or simply want to understand how gold functions as portfolio protection during geopolitical crises, the lesson from three decades of military conflicts is consistent: gold does not just react to wars. It reacts to the uncertainty that surrounds them. And in a world where that uncertainty shows no signs of fading, gold’s role as a safe haven feels more relevant than it has in a generation.