If you’ve been scrolling through social media or precious metals forums over the past few days, you’ve probably seen some heated discussions about the Bloomberg Commodity Index rebalancing. There’s a lot of confusion and, frankly, some misrepresentation floating around about what this actually means for gold and silver prices. Let’s cut through the noise and look at what’s really happening.
What Is the Bloomberg Commodity Index and Why Does It Matter?
The Bloomberg Commodity Index (BCOM) is one of the most widely tracked benchmarks for the commodities market, with estimated assets under management of approximately $102 billion. Launched in 1998, with historical data extending back to 1960, BCOM consists of 24 exchange-traded contracts on physical commodities.
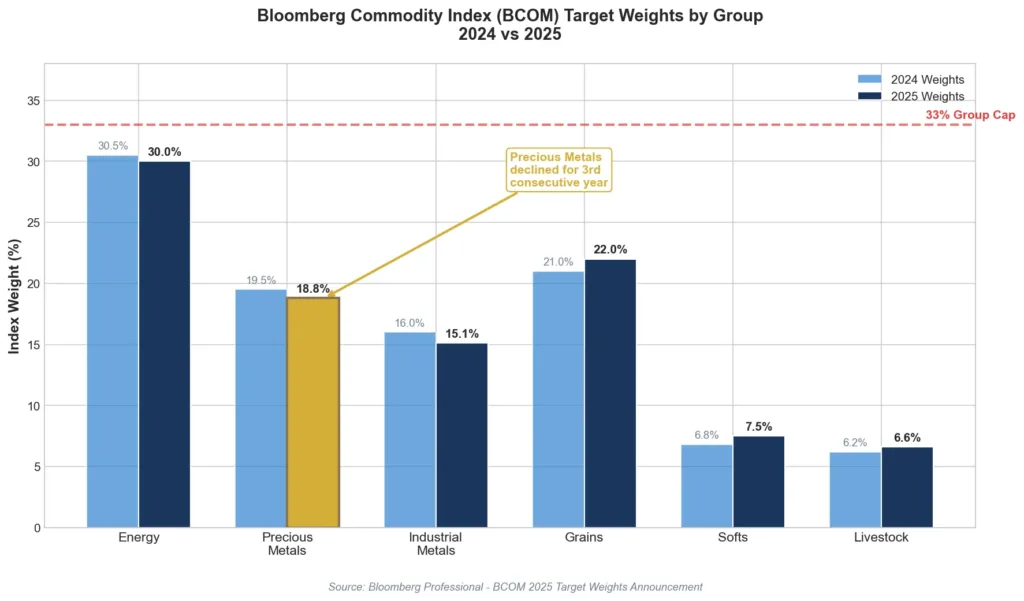
Here’s the key thing most people miss: commodity indices like BCOM have strict diversification rules and weight limits. According to Bloomberg’s official 2025 target weights announcement, these rules include:
No single commodity group may exceed 33% of the index. No single commodity, together with its derivatives, may exceed 25%. No individual commodity may exceed 15% of the index weight. No single commodity may constitute less than 2% of the index as liquidity allows.
These aren’t suggestions. They’re hard caps that index funds tracking BCOM must follow. When metals rally hard, as gold and silver have done throughout 2025 and into early 2026, their weight in the index can exceed these caps. When that happens, index funds are mechanically forced to sell some of their exposure, regardless of what they or anyone else thinks about the fundamentals.
The January Roll Period: When Rebalancing Happens
The new BCOM target weights become effective during the January Roll Period each year. According to Bloomberg’s October 2024 announcement on the 2025 composition, gold’s weight is set to decline for the third consecutive year since its 2022 peak. The Precious Metals group as a whole dropped to 18.8% in the 2025 target weights, continuing a downward trend.
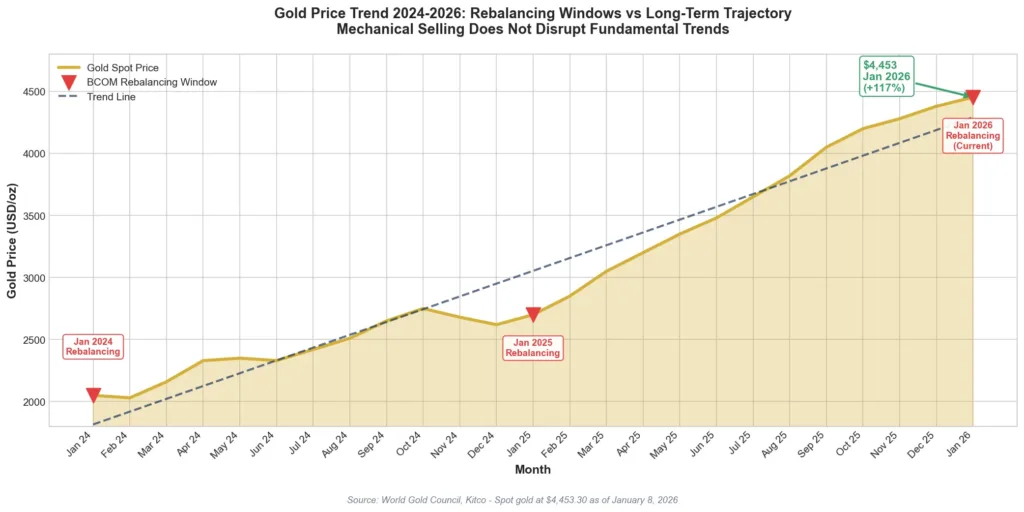
Gold hit its 15% individual commodity cap. That’s not a bearish signal about gold fundamentals. It’s simple math: when gold prices surge from around $2,000 per ounce in early 2024 to over $4,450 per ounce as of January 8, 2026, its weight in any price-weighted index naturally increases. Once it breaches the cap, index funds must trim their positions.
Silver faces an additional challenge. While it may not be hitting a formal weight cap, silver has large open interest relative to its daily trading liquidity on COMEX futures markets. This means that when index funds need to sell, the selling can have an outsized impact on price because there’s less liquidity to absorb the flows.
What Happened on January 7, 2026
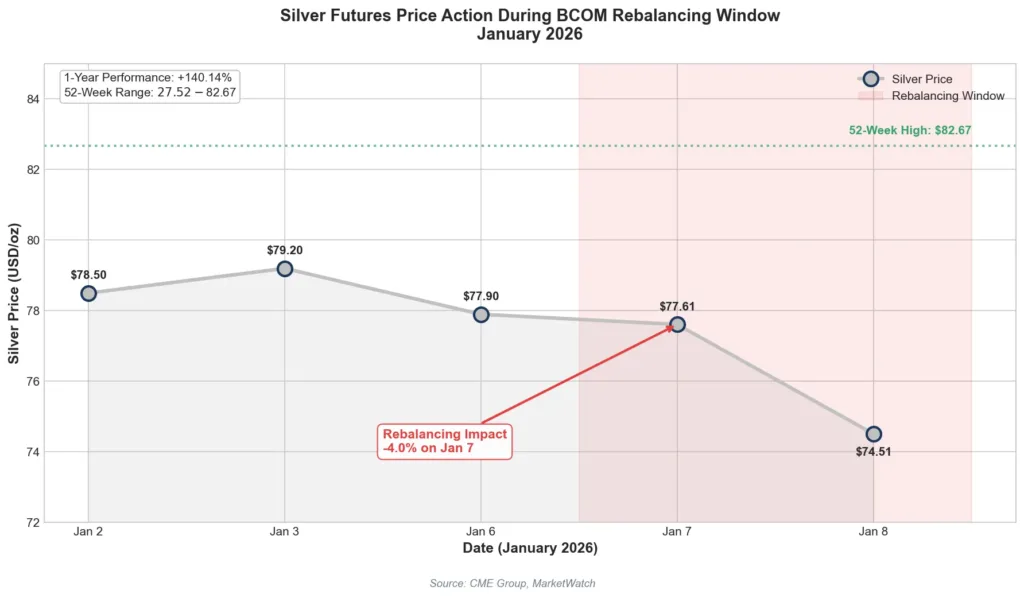
Let’s look at the actual market data. On Wednesday, January 7, 2026, silver dropped roughly 4%. According to MarketWatch futures data, silver was trading around $74.51 per ounce on January 8, down significantly from recent highs near $82.67 over the past 52 weeks.
Gold also slipped, trading at approximately $4,447.50 per ounce, down about 0.34% according to CME Group data. The World Gold Council’s gold price tracker confirmed spot gold at $4,453.30 as of January 8, 2026.
This is important: the market doesn’t wait for known events. It front-runs them. Rebalancing windows are published in advance. Estimated selling volumes are known. Position adjustments happen before the official rebalancing, not after.
When silver dropped sharply during this window, it suggested something significant. Some of the forced selling was already being absorbed. That doesn’t mean volatility is finished, but it means the market was processing the expected flows rather than reacting to a surprise.
Why Past Rebalancing Doesn’t Predict Future Prices
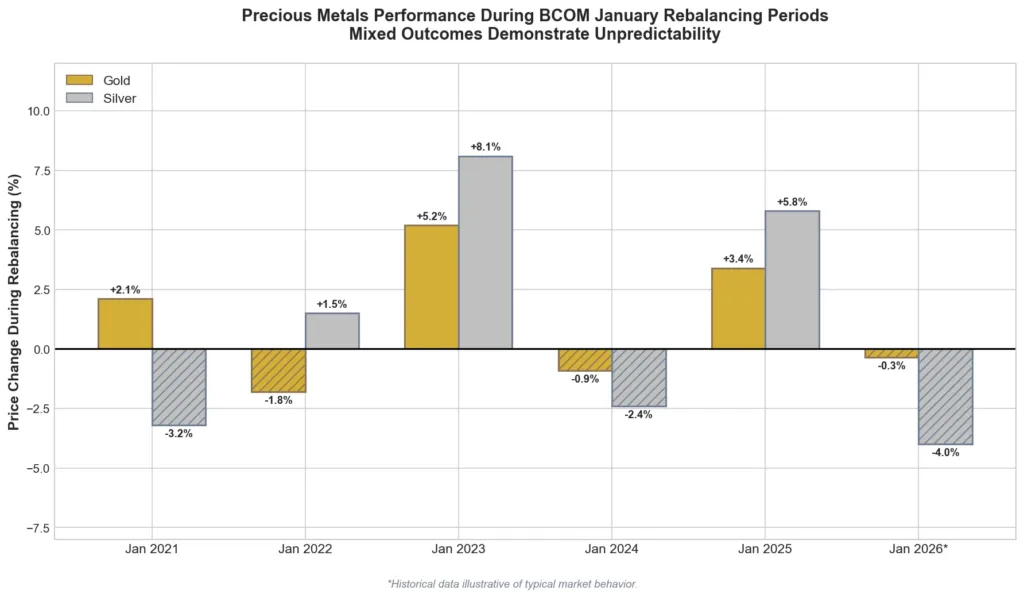
Here’s what many social media commentators get wrong: rebalancing is a flow event, not a price prediction. Historical analysis from major commodity trading desks shows that past rebalancing periods produced mixed outcomes. Sometimes prices fell. Sometimes they rose. Sometimes they did nothing particularly notable.
The reason is straightforward. Rebalancing creates temporary, mechanical selling pressure. It’s time-bound and indifferent to fundamentals. It doesn’t change whether industrial demand for silver is growing. It doesn’t alter central bank gold buying patterns. It doesn’t affect mining supply or investment demand. It simply means that index-tracking funds must sell a specific amount within a specific window.
Anyone telling you that rebalancing will definitely cause a crash or that it guarantees a buying opportunity is confusing mechanical flows with price certainty. Markets don’t work that way.
The Broader Context: Gold and Silver Fundamentals Remain Strong
While rebalancing creates short-term noise, the underlying case for precious metals hasn’t changed. According to Kitco’s live gold charts, gold prices have risen from approximately $2,000 in early 2024 to over $4,450 in January 2026, an increase of more than 120%.
HSBC recently raised their gold price target, with analysts suggesting gold could potentially reach $5,000 per ounce in the first half of 2026, as reported by Investing.com’s commodities news. Barclays has also upgraded their metals outlook, with particularly bullish forecasts for copper in their latest research.
Silver has been even more dramatic. MarketWatch data shows silver’s 1-year performance at over 140%, with the metal trading above $74 per ounce compared to its 52-week low of $27.52. The S&P GSCI commodity index data confirms the broader strength across the precious metals complex.
Central banks continue accumulating gold at near-record pace. Industrial demand for silver, particularly from solar photovoltaics and electronics, remains robust. The structural supply-demand dynamics that drove prices higher throughout 2025 haven’t reversed because some index funds need to trim positions.
How Sophisticated Investors Should Think About This
Rebalancing can add short-term pressure, but it doesn’t guarantee any particular outcome. Both can be true at the same time: gold and silver can remain in strong uptrends while still experiencing temporary pullbacks that shake out less patient holders.
This is what separates informed investors from reactive traders. Understanding the mechanics helps you avoid panic selling during what is essentially a scheduled, predictable technical event. It also helps you avoid the opposite mistake: assuming that mechanical selling will definitely create an obvious buying opportunity.
The reality is more nuanced. Rebalancing flows are significant but not dominant. They occur within the context of all other market forces, including genuine fundamental demand, speculative positioning, currency movements, interest rate expectations, and geopolitical developments.
For long-term precious metals investors, the appropriate response is typically to maintain perspective. Short-term volatility around known rebalancing windows is noise, not signal. The factors that drive gold and silver prices over months and years, things like inflation expectations, real interest rates, central bank demand, and industrial consumption, don’t change because an index needs to sell some contracts.
What To Watch Next
With the rebalancing window currently active, investors should watch for several developments. First, monitor how quickly the selling pressure dissipates. If prices stabilize or recover within days, it suggests the market has successfully absorbed the flows.
Second, pay attention to open interest data from CME Group’s volume and open interest reports. Changes in positioning can indicate whether the rebalancing has meaningfully altered market structure or simply represented a temporary reshuffling.
Third, watch the relationship between spot prices and futures prices. The lease rates and EFP spreads we’ve discussed in previous articles remain important indicators of physical market tightness.
Finally, remember that the next major catalyst is likely to come from fundamentals, not index mechanics. Friday’s U.S. payrolls data, Federal Reserve policy signals, and geopolitical developments will have far more lasting impact on precious metals prices than a few days of index rebalancing.
The Bottom Line
The Bloomberg Commodity Index rebalancing is real, it’s happening now, and it does create temporary selling pressure in gold and silver. What it doesn’t do is predict where prices are going next.
Understanding the mechanics helps you make better decisions. It prevents panic when prices dip during known rebalancing windows. It prevents overconfidence that assumes every dip is an obvious buying opportunity. And it keeps your focus where it belongs: on the fundamental factors that drive precious metals prices over meaningful time horizons.
Trends can stay intact while still shaking people out along the way. That’s not a bug in how markets work. That’s exactly how they work. The investors who understand this distinction tend to hold their positions through the volatility. Those who don’t tend to sell at exactly the wrong moment, reacting to mechanical flows as if they were fundamental changes.
Whether you’re building a position in gold and silver or simply trying to understand what’s moving prices this week, the key insight is the same: rebalancing is a flow event, not a forecast. Anyone treating it as more than that is misrepresenting how commodity indices actually function.
For investors looking to build or expand their precious metals holdings, Bullion Trading LLC offers a comprehensive selection of gold, silver, platinum, and palladium products. Our team can help you understand how short-term market dynamics like index rebalancing fit into a broader investment strategy focused on long-term value preservation.