
When gold experiences sharp intraday price swings of 3-5%, market commentators often interpret it as weakness in the precious metal itself. But seasoned market observers recognize these volatile moves as something entirely different: gold functioning as the financial system’s early warning system. Recent gold price volatility in late 2025, rather than signaling problems with gold, reveals mounting stress in the broader financial system’s liquidity infrastructure.
Understanding this distinction matters enormously for investors. Gold’s role as a liquidity indicator provides crucial signals about developing risks that may not yet appear in stock prices or credit spreads. The pattern playing out in November 2025 echoes historical episodes when gold’s behavior warned of impending financial system turbulence.
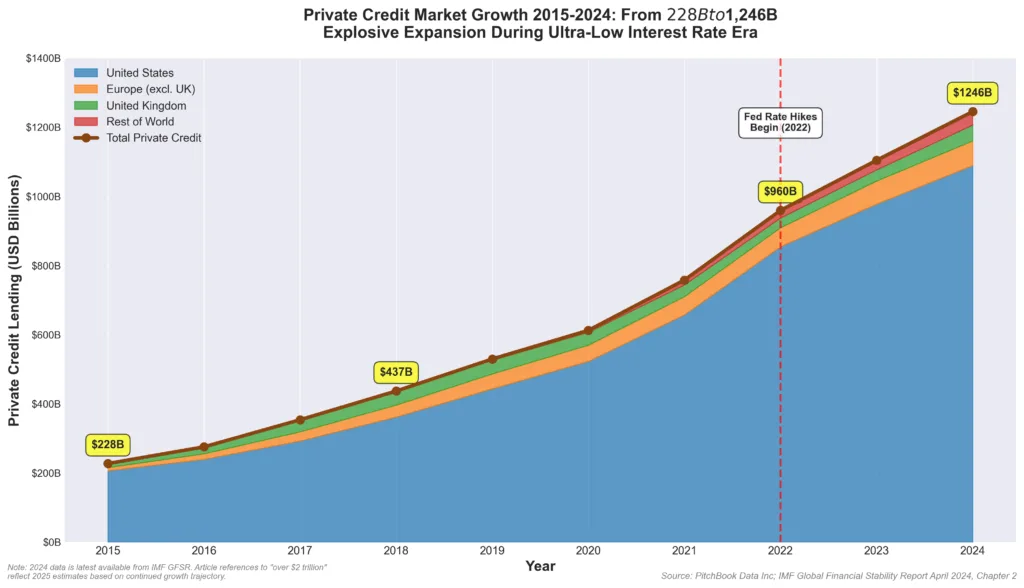
The Private Credit Market: Shadow Banking’s $2 Trillion Problem
The private credit market has emerged as one of the most significant vulnerabilities in post-2008 finance. This sector encompasses lending by non-bank entities like hedge funds, private equity firms, and specialty finance companies. Unlike traditional banks subject to rigorous oversight, private credit operates with far less transparency.
According to data from the Federal Reserve and Bank for International Settlements, the private credit market has grown to exceed $2 trillion as of 2025, up from approximately $800 billion in 2018. This explosive growth filled a void left by banks that retreated from riskier lending after post-crisis regulations tightened.
The boom occurred during ultra-loose monetary policy from 2009-2021. As detailed in our analysis of Federal Reserve policy impacts on gold, borrowers could service even marginal loans because refinancing remained easy and cheap capital was always available.
The Liquidity Trap Revealed
Starting in 2022, the Fed began the most aggressive rate hiking cycle in four decades, raising rates from near-zero to above 5.25%. This created severe stress in private credit markets:
Higher Borrowing Costs: Companies with floating-rate loans saw interest costs double or triple. According to Financial Times reporting, defaults began climbing steadily through 2024-2025.
Maturity Wall: The sector faces a significant “maturity wall” in 2025-2027, with hundreds of billions in loans coming due. With rates high and credit tight, refinancing has become difficult or impossible for marginal borrowers.
Mark-to-Market Avoidance: Private credit valuations occur quarterly based on internal models, allowing lenders to avoid marking loans to realistic values. But when funds face redemptions, forced sales reveal that loans worth 100 cents on paper might fetch 70-80 cents in actual transactions.
Liquidity Mismatch: Many funds offer quarterly redemptions while holding illiquid loans. When investors request redemptions simultaneously, funds must either suspend redemptions or sell assets at fire-sale prices.
The Cockroach Problem: Hidden Defaults
Bloomberg reporting indicates troubled loans have been increasingly “extended and pretended” throughout 2024-2025. Rather than recognizing defaults, lenders extend maturities or provide additional capital, preserving the fiction that loans remain current while increasing exposure to deteriorating credits.
The problem compounds because interconnections remain opaque. A hedge fund experiencing stress might be forced to sell liquid assets like gold to raise cash, creating contagion from illiquid private credit to liquid public markets. As examined in our analysis of systemic banking risks, these mechanisms played crucial roles in previous financial crises.
Gold’s Dual Role: Liquid Asset and Crisis Hedge
Gold occupies a unique position: it’s simultaneously a highly liquid asset and a crisis hedge. This dual role explains gold’s sometimes counterintuitive behavior during financial stress.
Major financial institutions use gold as high-quality collateral in repo markets. According to LBMA market analysis, the London gold market facilitates hundreds of billions in secured lending using gold as collateral. When liquidity stress emerges, institutions can immediately sell gold, use it in repo transactions, or secure gold-backed loans.
This means gold often experiences selling pressure during the initial phase of financial crises as institutions liquidate their most liquid assets first to raise cash for margin calls or redemptions.
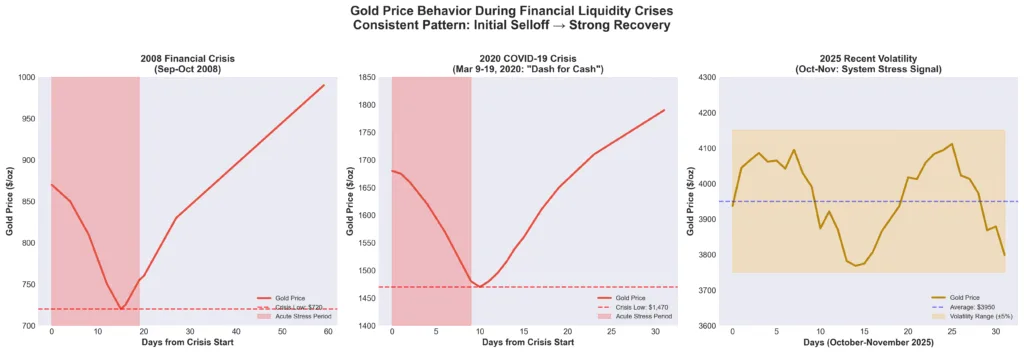
The “Dash for Cash” Pattern
March 2020 provided a perfect example. Between March 9-19, gold declined approximately 12% despite the crisis environment. This occurred as leveraged investors faced massive margin calls, forcing liquidation of liquid assets. The iShares Gold Trust and SPDR Gold Shares both experienced significant outflows as institutional investors raised cash.
Crucially, gold’s decline proved temporary. By August 2020, gold reached new all-time highs above $2,060 per ounce as the Fed’s response, unlimited quantitative easing and zero rates, drove investors toward hard assets. The pattern: initial selling during acute liquidity stress, followed by sustained appreciation as monetary responses debase currencies.
Recent Gold Volatility: The Warning Signal
Gold experienced notable intraday volatility during October-November 2025, with sessions showing price swings of 3-5%. According to LBMA gold price data, gold’s average daily volatility increased significantly in Q4 2025 despite maintaining elevated price levels near record highs.
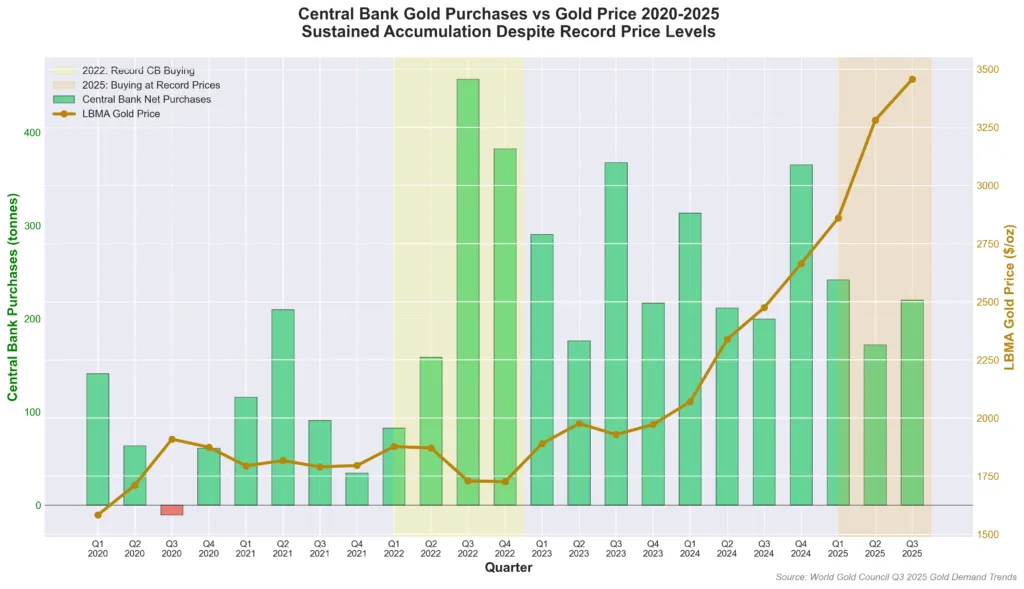
The World Gold Council’s Q3 2025 demand data showed continued strong investment demand of 537 tonnes and central bank purchases of 220 tonnes, totaling 757 tonnes in Q3 alone, demonstrating price-insensitive accumulation, as detailed in our Q3 demand analysis. This structural demand should support stable prices. When gold instead experiences sharp selloffs despite strong fundamentals, it signals forced liquidation driven by liquidity stress elsewhere.
CME gold options data showed elevated implied volatility throughout October-November 2025. This premium indicates market participants pricing in continued potential for sharp moves, consistent with ongoing liquidity stress in the broader financial system.
When Liquidity Vanishes: The Fed Always Blinks
A consistent historical pattern provides crucial context: when liquidity stress threatens systemic stability, central banks intervene. The Fed’s mandate to maintain financial stability ultimately supersedes inflation targeting when the two conflict.
Historical examples include:
- 2008: Fed slashed rates from 5.25% to 0.25%, implemented $3.5 trillion in QE
- 2018-2019: Fed intervened when repo rates spiked, ending quantitative tightening
- March 2020: Unlimited QE, corporate bond purchases, money market fund backstops
As discussed in our analysis of Fed policy impacts, these interventions share a principle: when faced with liquidity crisis, the Fed prioritizes system stability over all other considerations.
This creates asymmetry sophisticated investors recognize. The downside, deflationary depression, gets prevented by Fed intervention. The upside, persistent inflation and currency debasement, becomes the likely outcome. Gold benefits in either scenario except deflation, and the Fed’s pattern makes sustained deflation unlikely.
Credit Markets Drive the Economy
According to Bank for International Settlements research, credit availability correlates far more strongly with GDP growth than inflation or policy rates. When credit markets seize up, economic activity collapses regardless of other indicators.
The concentration of risk in private credit creates systemic vulnerability because it sits outside the traditional banking system where the Fed can intervene directly. Yet if enough private credit funds experience simultaneous stress, contagion spreads to traditional banks, broker-dealers, and insurance companies.
This creates conditions for exactly the kind of systemic crisis that forces Fed intervention through currency-devaluing actions that support gold prices.
Why Gold Volatility Signals Opportunity
Historical analysis shows gold’s post-intervention performance has been remarkably consistent:
- Post-2008: Bottomed at $720/oz in October 2008, rallied 165% to $1,921/oz by September 2011
- Post-COVID March 2020: Bottomed at $1,470/oz on March 16, rallied 40% to $2,067/oz by August
The pattern repeats: acute liquidity stress causes temporary gold selling, Fed intervention restores liquidity and debases currency, gold subsequently rallies to new highs.
Central Banks Know
Perhaps the most telling signal comes from central bank behavior. As detailed in our Q3 demand analysis, according to World Gold Council preliminary estimates, central banks purchased approximately 634 tonnes through Q3 2025, remaining on pace for elevated accumulation despite record price levels.
Central banks, staffed by monetary economists with confidential financial system data, are accumulating gold at historically elevated prices despite the opportunity cost. This reflects their assessment of long-term currency risk and financial system fragility. As examined in our analysis of structural bull markets in gold, central bank buying represents the strongest fundamental driver supporting gold’s appreciation.
The Fire Alarm, Not the Fire
Gold’s recent volatility functions as an early warning system. The alarm makes noise when it detects smoke, but the alarm itself isn’t the problem. Similarly, gold’s price volatility during financial stress isn’t a gold problem, it’s signaling problems in the broader system.
Investors who understand this distinction gain strategic advantage. Rather than viewing gold weakness as a reason to sell, they recognize it signals that:
- Financial system stress is building in areas not yet visible in mainstream indicators
- Fed intervention is likely forthcoming, which historically supports gold
- Temporary dislocations create accumulation opportunities before policy responses drive prices higher
Investment Implications
For precious metals investors, current conditions suggest several considerations:
View Volatility as Signal, Not Noise: Sharp selloffs despite strong fundamentals create entry points rather than exit signals.
Maintain Long-Term Focus: The pattern of liquidity crisis → Fed intervention → gold appreciation plays out over quarters and years, not days.
Physical vs. Financial Exposure: During liquidity crises, physical ownership eliminates counterparty risk. The premium on physical availability, as discussed in our lease rate analysis, reflects this value.
Dollar-Cost Averaging: Systematic accumulation smooths out short-term volatility while building positions.
Conclusion: Listen to What Gold Is Telling You
Gold’s behavior in November 2025, experiencing volatility despite strong fundamental demand and continued central bank accumulation, isn’t weakness. It’s gold performing its historical role as the financial system’s early warning indicator.
The private credit market’s structural problems, approaching maturity wall, and persistent inflation create conditions remarkably similar to previous episodes that ultimately proved highly supportive for gold prices.
Rather than viewing recent gold volatility as a concern, investors should recognize it as the early warning signal it represents. The fire alarm is ringing. Rather than covering your ears, pay attention to what gold is telling you about developing stress in the financial system.Whether you’re beginning to build precious metals positions or adding to existing holdings, Bullion Trading LLC offers comprehensive gold and silver products backed by market expertise and commitment to investor education. For more insights, explore our analysis of gold’s structural bull market characteristics and stay informed about the factors driving long-term value in precious metals investing.