
Gold has pulled back from its October 2025 highs above $4,000 per ounce, currently trading around $3,932 as of October 28, 2025. The correction has triggered predictable headlines about “overbought conditions” and technical selling pressure. But beneath the short-term volatility, the structural foundation supporting gold’s multi-year bull market hasn’t just remained intact, it’s strengthened.
For investors navigating precious metals markets in 2025, understanding the distinction between temporary corrections and structural trends has never been more critical. While traders focus on daily price swings, the underlying architecture of this gold bull market points decisively higher over the coming years.
What “Structurally Bullish” Really Means
A structural bull market isn’t measured in daily charts or monthly oscillators. It’s built on fundamental forces that create persistent demand growth and supply constraints over multi-year timeframes. In gold’s case, four primary pillars support the structural case for higher prices, and each has intensified throughout 2025 rather than weakened.
Central Banks Continue Historic Accumulation
According to the World Gold Council’s Q2 2025 Gold Demand Trends report, central banks continue their remarkable accumulation of gold reserves. In Q1 2025, official sector purchases reached 244 tonnes, the highest first-quarter total on record. While Q2 saw a moderation to 166 tonnes, the full-year trajectory remains extraordinary.
For 2024, central bank purchases topped 1,000 tonnes for the third consecutive year, establishing a new baseline for official sector demand. This isn’t speculative investment demand subject to sentiment shifts. These are strategic sovereign decisions to diversify reserves away from dollar-denominated assets.
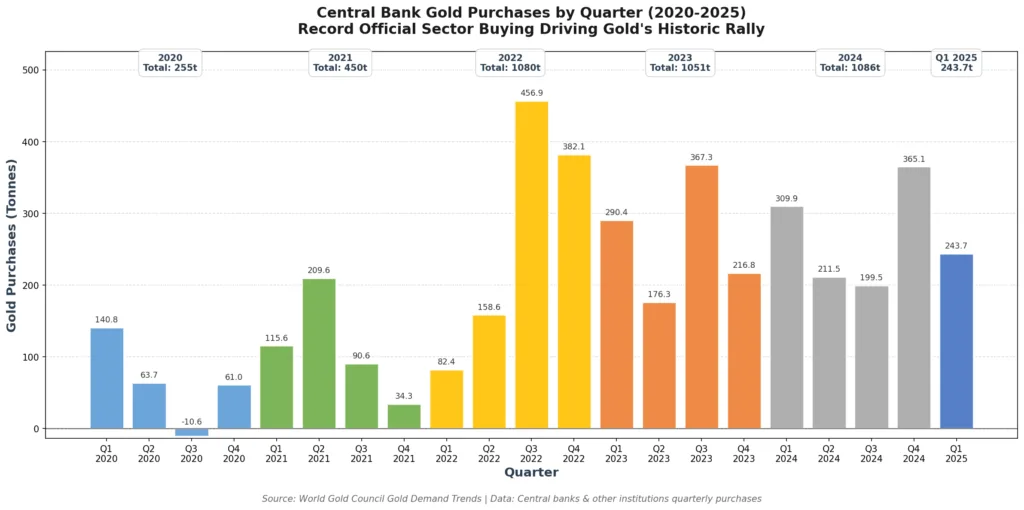
The implications extend beyond simple demand math. When central banks accumulate gold, that metal typically exits the liquid market permanently. Unlike ETF holdings that can reverse quickly, official sector gold enters vaults where it remains for decades. This represents a structural tightening of available supply.
Real Yields Have Peaked
The relationship between real yields (nominal interest rates minus inflation) and gold prices forms one of the metal’s most reliable structural drivers. When real yields decline, gold becomes relatively more attractive versus bonds and cash.
According to Federal Reserve data tracked by FRED, the 10-year Treasury Inflation-Protected Securities (TIPS) yield stood at 1.73% as of October 24, 2025. While positive, this represents a significant decline from the peak above 2.5% seen in late 2023.
More importantly, the structural trajectory points lower. The Federal Reserve has begun its expected easing cycle, with the first rate cut delivered in September 2025. Meanwhile, inflation remains sticky above the Fed’s 2% target despite months of restrictive policy. This combination, easing monetary policy meeting persistent inflation, creates the exact environment where real yields compress and gold thrives.
Historical precedent is clear: gold’s greatest bull markets occur when real yields remain low or negative for extended periods. The current environment checks every box.
Fiscal Discipline Has Evaporated
Perhaps no structural factor supporting gold is more powerful, or more certain, than the complete abandonment of fiscal restraint across developed economies.
The U.S. national debt now exceeds $38 trillion as of October 2025, representing approximately 125% of GDP. More critically, the debt continues growing faster than the economy itself. In fiscal year 2025, the U.S. government spent $1.216 trillion just on interest payments, representing 17% of total federal spending according to Treasury data.
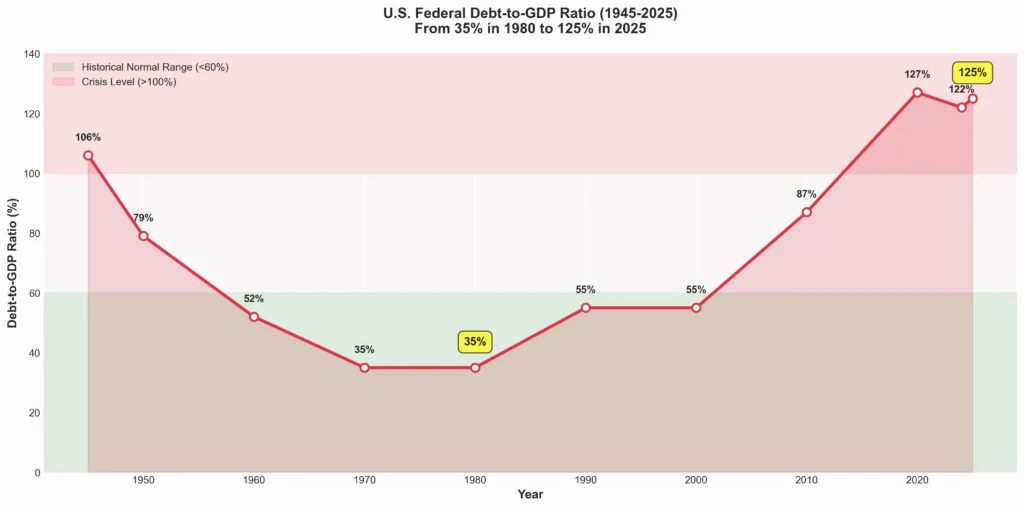
This creates what market participants call a “debt trap.” As debt levels rise, interest payments consume an increasing share of government revenue, forcing either deeper deficits (more borrowing) or spending cuts politically unpalatable to implement. Neither outcome supports currency strength or fiscal credibility.
Every major Western economy faces similar dynamics. The European Union, United Kingdom, Japan, all are running structural deficits with debt-to-GDP ratios that would have been considered crisis-level just two decades ago. Historically, this combination, high debt levels, low real rates, persistent deficits, has always favored hard assets over paper currencies.
Physical Supply Growth Remains Constrained
While demand drivers dominate the gold narrative, supply-side constraints provide critical structural support. According to World Gold Council data, Q2 2025 mine production reached a quarterly record, yet annual growth remained modest at just 1% year-over-year. Despite record-high prices incentivizing production, the mining industry struggles to meaningfully expand output.
This sluggish supply response isn’t temporary. The global gold mining industry faces multiple structural headwinds that prevent rapid production increases even as gold trades near $4,000 per ounce:
- Discovery Rates Declining: Major new gold discoveries have become increasingly rare. Average ore grades have declined significantly over the past two decades, meaning miners must process more ore to extract the same amount of gold.
- Permitting Timelines Extending: Environmental reviews and regulatory approvals now routinely take 7-10 years or longer in developed markets. This lag between discovery and production means today’s high prices won’t translate to meaningful supply increases until the early 2030s at minimum.
- Capital Intensity Rising: Declining ore grades mean larger, deeper, more capital-intensive mining operations. The marginal cost of new gold production continues rising, providing a floor under prices.
These supply constraints mean that even modest demand growth must be met through higher prices rather than increased production. This supply-demand imbalance provides fundamental support distinct from monetary or financial drivers.
The Valuation Disconnect: Gold Remains Underowned
Despite touching record nominal prices above $4,000 per ounce in October 2025, gold remains remarkably underowned within institutional and private portfolios.
Global private wealth allocations to gold hover below 1% according to World Gold Council estimates. Institutional investors hold approximately 2-3% of assets under management in gold exposure, well below the 5-10% levels seen during previous crisis periods in 2008-2011.
This underownership matters because it represents latent demand that hasn’t yet materialized. Consider the mathematics: Global institutional assets under management exceed $100 trillion. A mere 1% shift from cash or bonds into gold would represent $1 trillion in demand, roughly three times annual mine production.
The recent surge in gold-backed ETF inflows confirms this reallocation has begun. Q1 and Q2 2025 saw the strongest first-half ETF demand since 2013, with global gold ETFs adding 397 tonnes. But this represents early-stage adoption, not saturation.
Historical Precedent: The Long Game
The last two great gold bull markets, 1971-1980 and 2001-2011, both delivered approximately 6x moves from trough to peak over roughly decade-long timeframes. Neither moved in straight lines. Both featured sharp corrections that felt devastating in real-time but represented mere consolidations within the broader trend.
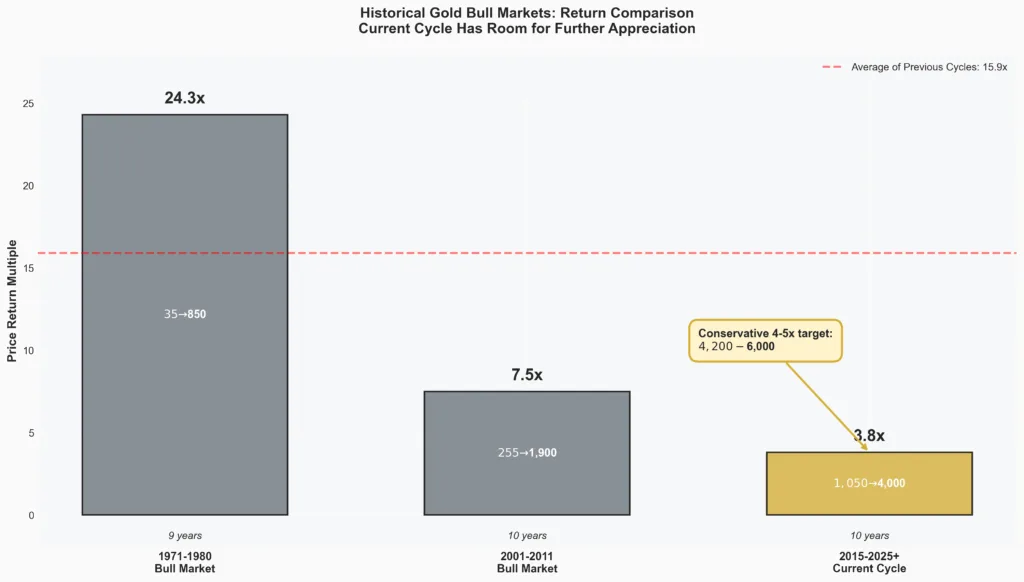
The 1970s bull market saw gold rise from $35 to $850, delivering a 24x return. But it experienced corrections exceeding 30% multiple times, including a brutal 47% decline from 1974 highs. The 2001-2011 cycle delivered 6.5x returns from $250 to $1,900, also featuring corrections exceeding 20%.
The current cycle began near $1,050-$1,200 in 2015-2016. Even a conservative 4-5x return from those levels implies $4,200-$6,000 gold before this structural bull market exhausts itself. Historical patterns suggest significant additional upside remains if structural drivers persist.
The October 2025 Correction in Context
The pullback from October’s highs above $4,000 to current levels around $3,932 represents approximately 2% from recent peaks. Several factors contributed to the October weakness:
- Profit-Taking After Extended Rally: Gold rose roughly 45% from January 2024 lows to October 2025 highs. Some profit-taking after such gains is healthy for the long-term trend.
- Dollar Strength: Temporary dollar strength against major currencies created headwinds for dollar-denominated gold prices, even as gold in other currencies held up better.
- Technical Selling: Month-end options expiration and stop-loss triggers at key technical levels amplified selling pressure, creating temporary dislocations.
- Liquidity Dynamics: As detailed in our analysis of gold and silver lease rates, temporary tightness in physical markets can create price volatility that ultimately resolves higher.
None of these factors challenge the structural case. They represent the normal volatility within an ongoing bull market, the kind of corrections that shake out weak hands while offering opportunity to patient investors.
Navigating Volatility Within the Structural Trend
For investors building precious metals positions, understanding how to navigate volatility within structural trends determines whether you capture the full move or get shaken out during corrections.
Dollar-Cost Averaging Smooths Timing Risk: Rather than attempting to time perfect entries, systematic accumulation across price levels reduces the impact of short-term volatility.
Position Sizing Matters: Structural conviction doesn’t mean reckless concentration. Appropriate position sizing (typically 5-15% of investable assets) allows maintaining positions through volatility without panic selling.
Product Selection Affects Experience: Different gold investments experience different volatility profiles. Physical gold in coins and bars provides the purest exposure but requires secure storage. Gold ETFs offer liquidity but carry counterparty risk. Understanding these trade-offs helps match investments to objectives.
Bottom Line: Structure Rewards Patience
Corrections shake out traders. Structure rewards patient investors.
Gold remains structurally bullish not because of any single data point or technical indicator, but because the monetary and fiscal system it’s measured against grows structurally weaker with each passing quarter.
The October 2025 correction changes precisely nothing about these fundamental realities:
- Central banks continue accumulating gold at near-record rates
- Real yields face structural downward pressure from persistent inflation and Fed easing
- Fiscal deficits show no signs of meaningful reduction
- Physical supply growth remains constrained by geological and regulatory realities
- Institutional and private allocations remain well below historical crisis levels
Short-term volatility might dominate headlines, but the deeper trend hasn’t changed. If anything, each new trillion dollars in government debt, each Fed rate cut into sticky inflation, each central bank gold purchase reinforces the structural case for significantly higher gold prices over the coming 3-5 years.
For investors building long-term wealth protection, the question isn’t whether gold will experience volatility, it will. The question is whether the structural drivers supporting multi-year price appreciation remain intact. By every measurable metric, they do.
Gold remains the asset that quietly exposes what’s broken in everything else. That reality transcends any single monthly correction.
Bullion Trading LLC offers comprehensive precious metals solutions for investors seeking to capitalize on structural trends while navigating short-term volatility. From popular gold coins like American Eagles to large institutional bars, our extensive inventory serves every investment strategy.