Gold traders have been watching paint dry for the better part of three months. While the precious metal once commanded headlines with its relentless march higher through 2024 and early 2025, the summer doldrums have brought something different entirely: a grinding sideways consolidation that’s testing the patience of bulls and bears alike.
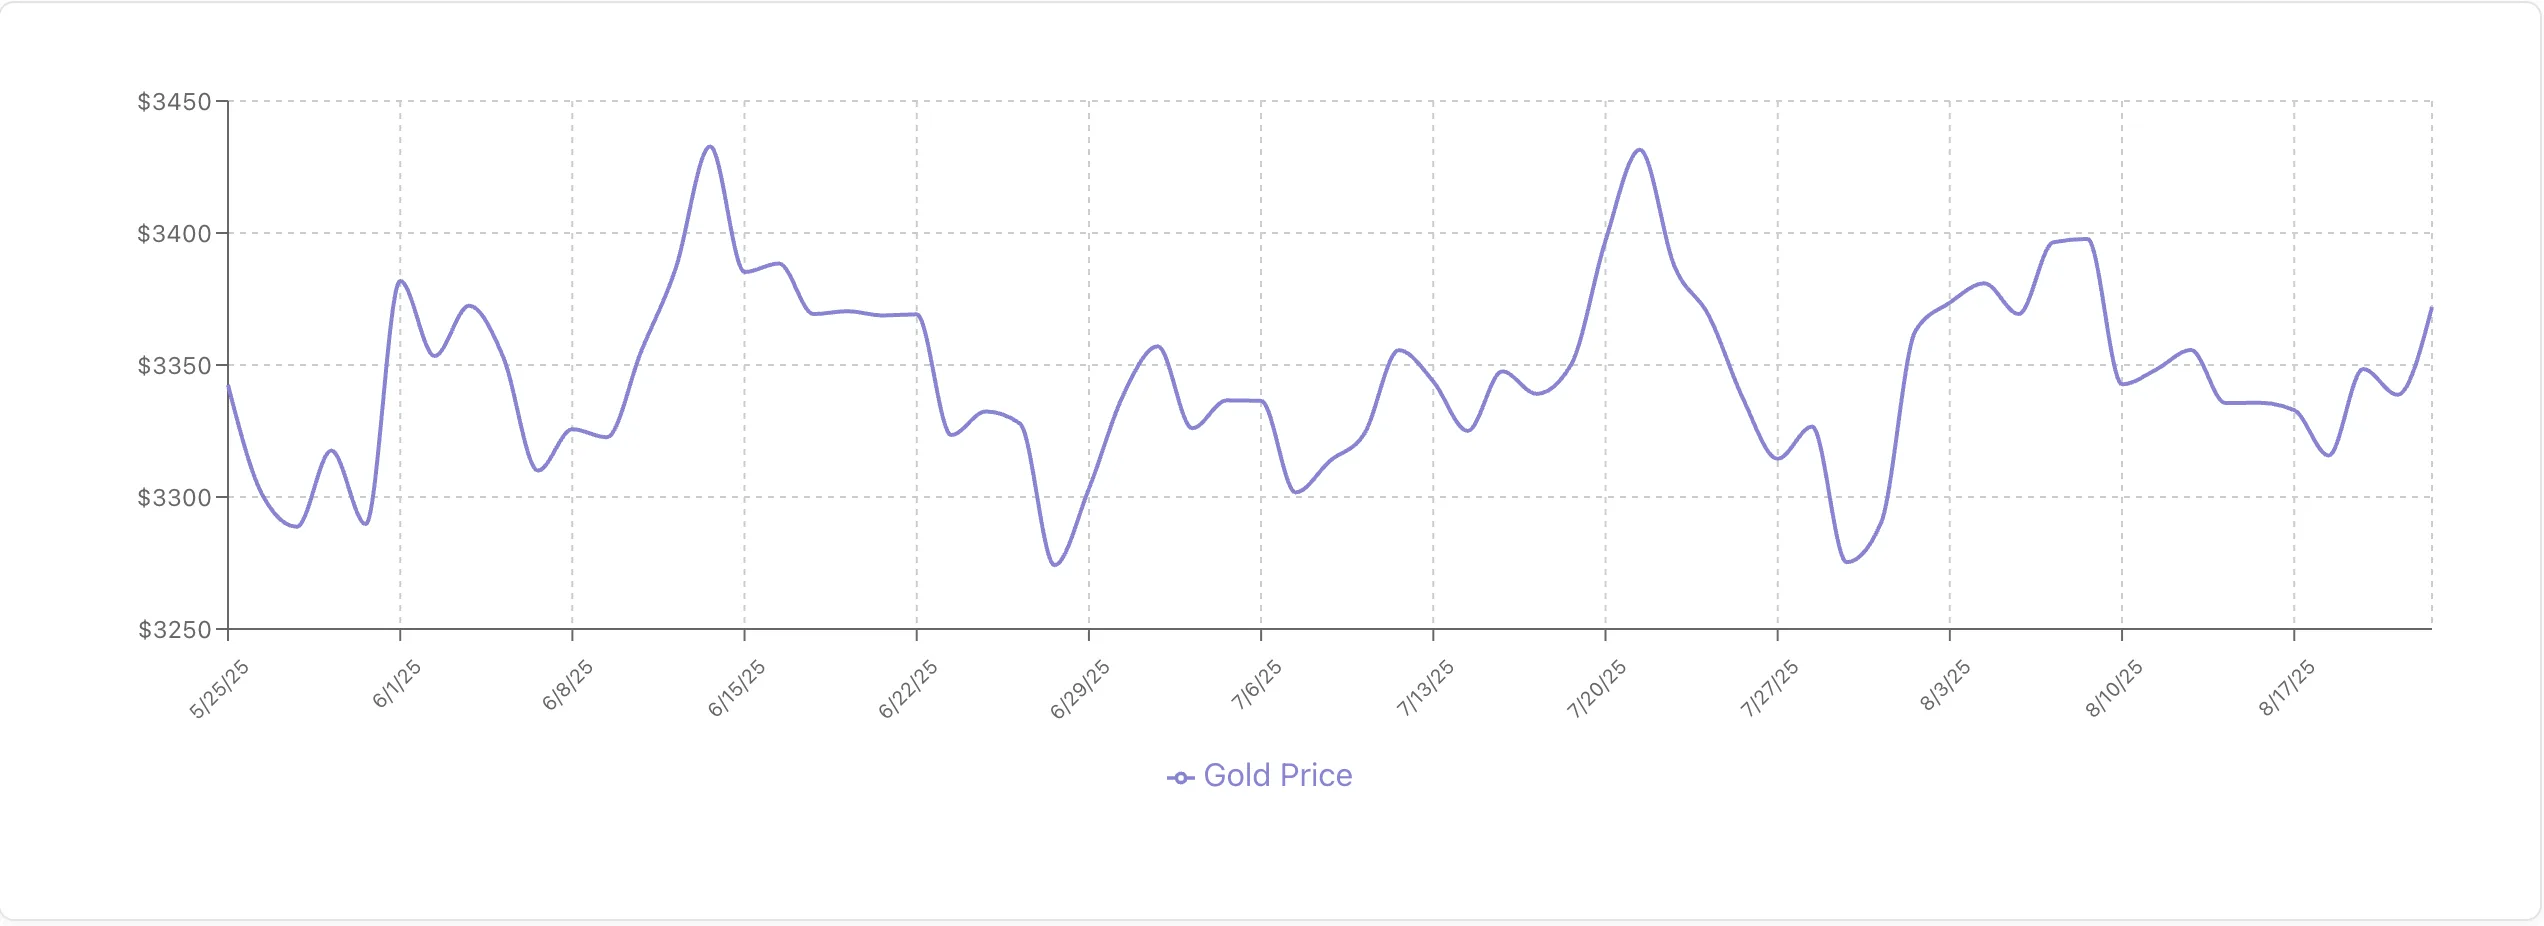
The numbers paint a picture of indecision. Gold fell to 3,342.75 USD/t.oz on August 21, 2025, down 0.07% from the previous day, with the metal down 2.58% over the past month, yet it remains substantially higher than year-ago levels. This sideways action isn’t just noise; it’s a critical juncture that could determine whether gold resumes its historic rally or finally succumbs to the correction many analysts have been predicting.
The Anatomy of a Consolidation
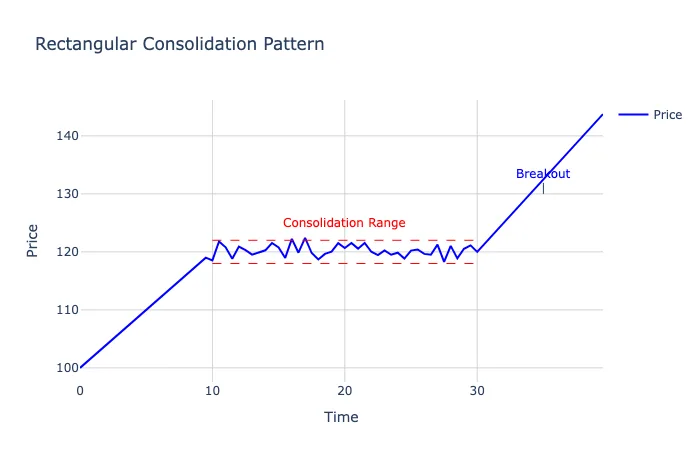
After reaching dizzying heights earlier this year, gold has settled into what technicians call a rectangular consolidation pattern. The quarterly average price reached US$2,860/oz in Q1, up 38% year-over-year, driven by a perfect storm of supportive factors. But since then, the metal has been range-bound, unable to sustain moves above the $3,400 level while finding consistent support near $3,200.
This type of price action typically emerges when powerful opposing forces reach equilibrium. On one side, you have the long-term structural bulls, backed by central bank buying and geopolitical uncertainty. On the other, momentum traders are growing increasingly nervous as technical indicators flash warning signs.
Momentum Indicators: The Yellow Lights Are Flashing
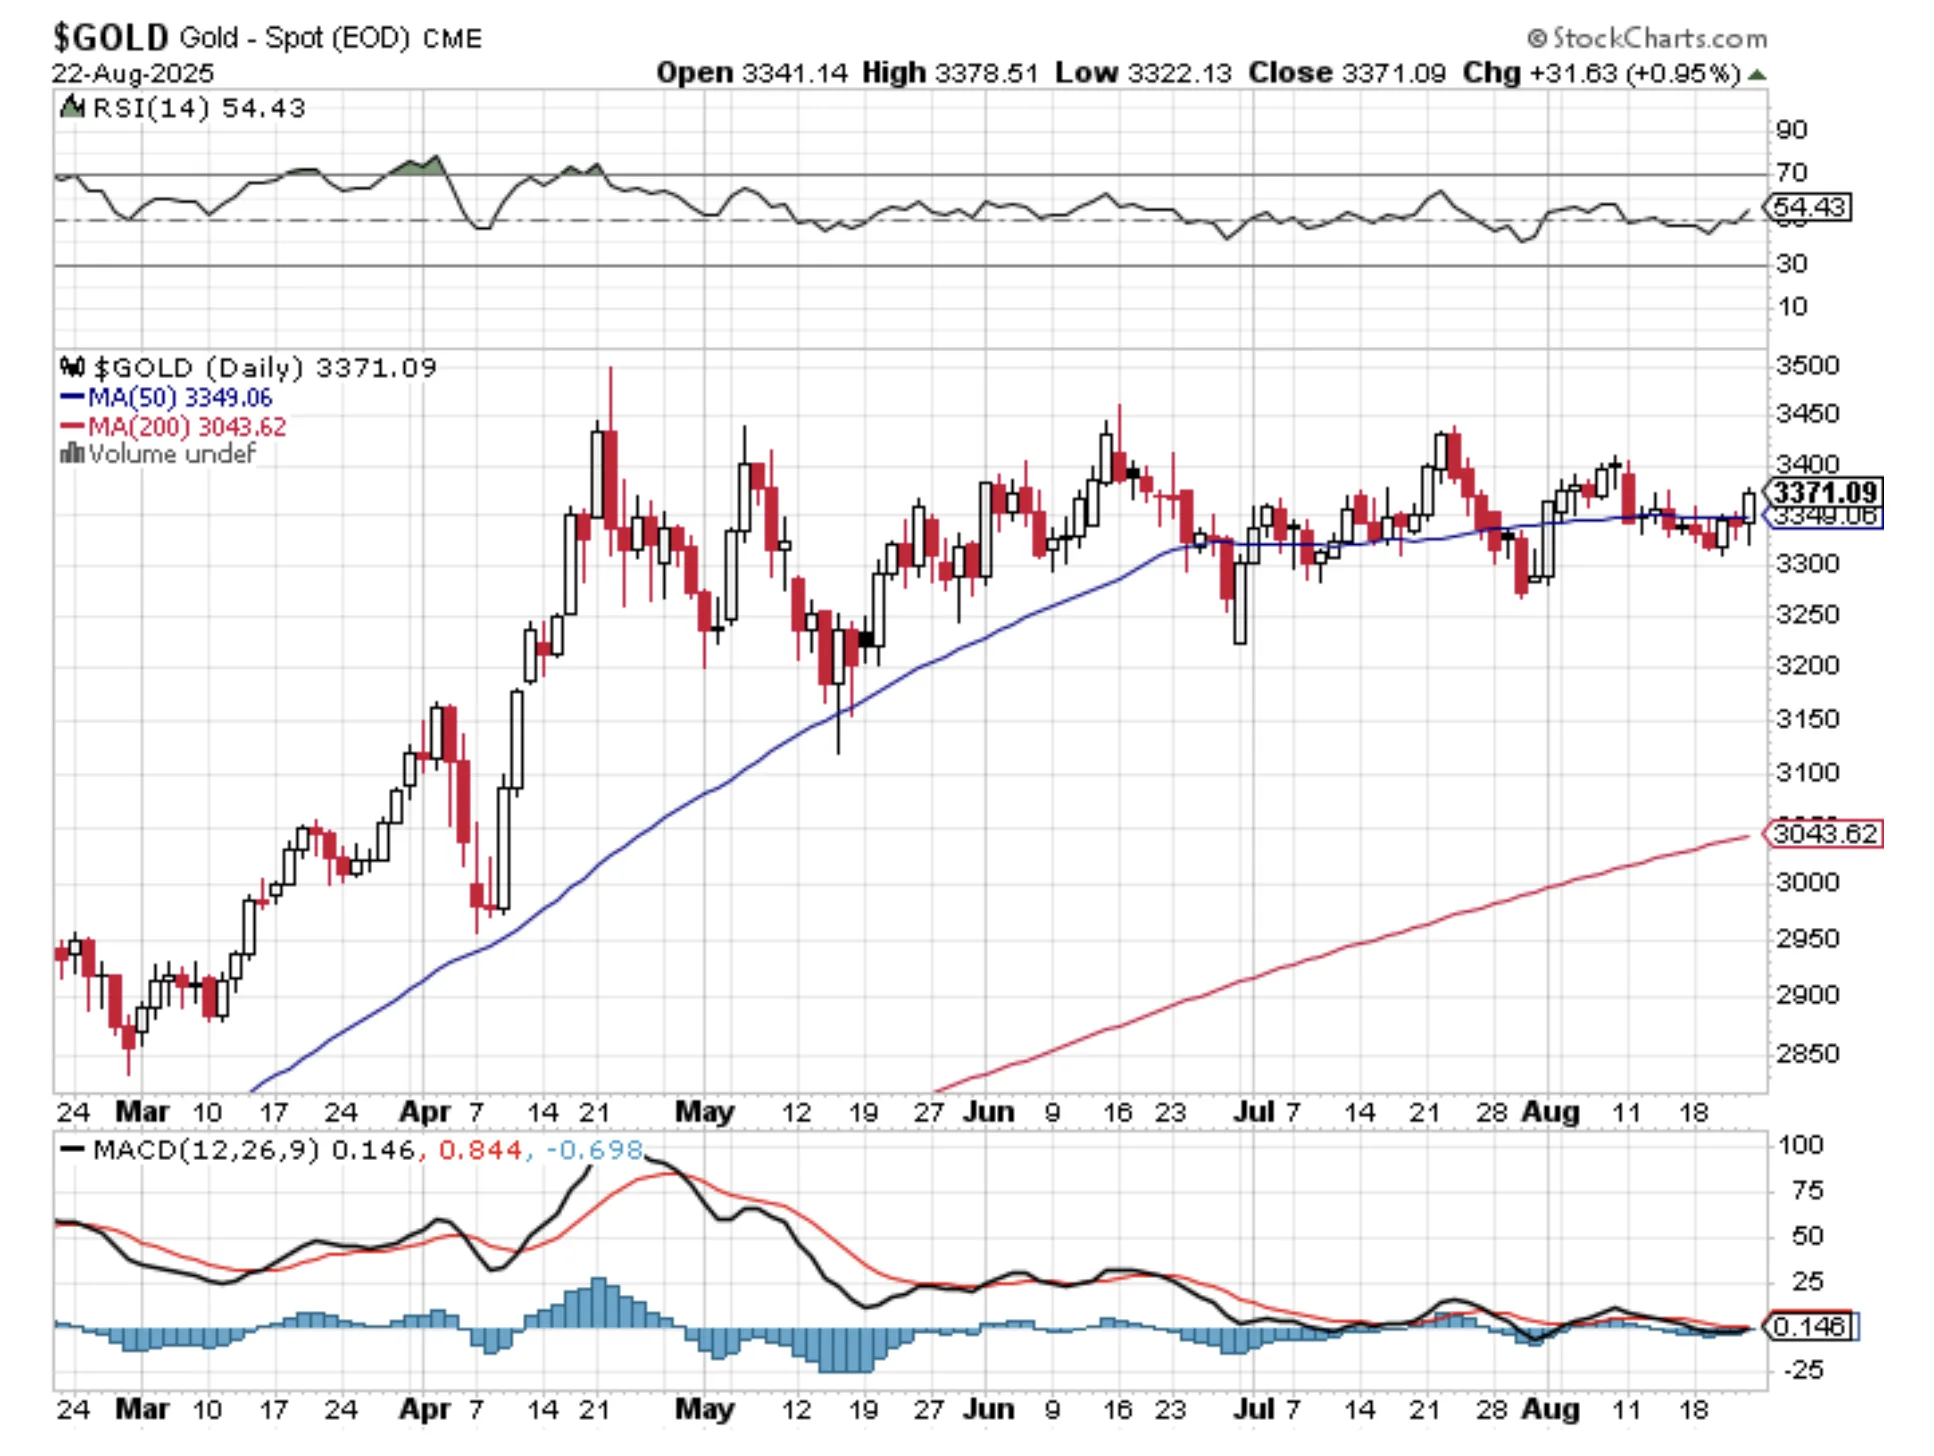
The technical picture has deteriorated notably in recent weeks, with several key momentum indicators suggesting caution ahead. The RSI has turned lower, moving out of overbought territory and down to the 60 level, while MACD values crossed below the zero line and continue to decline in negative territory, indicating weakening bullish momentum.
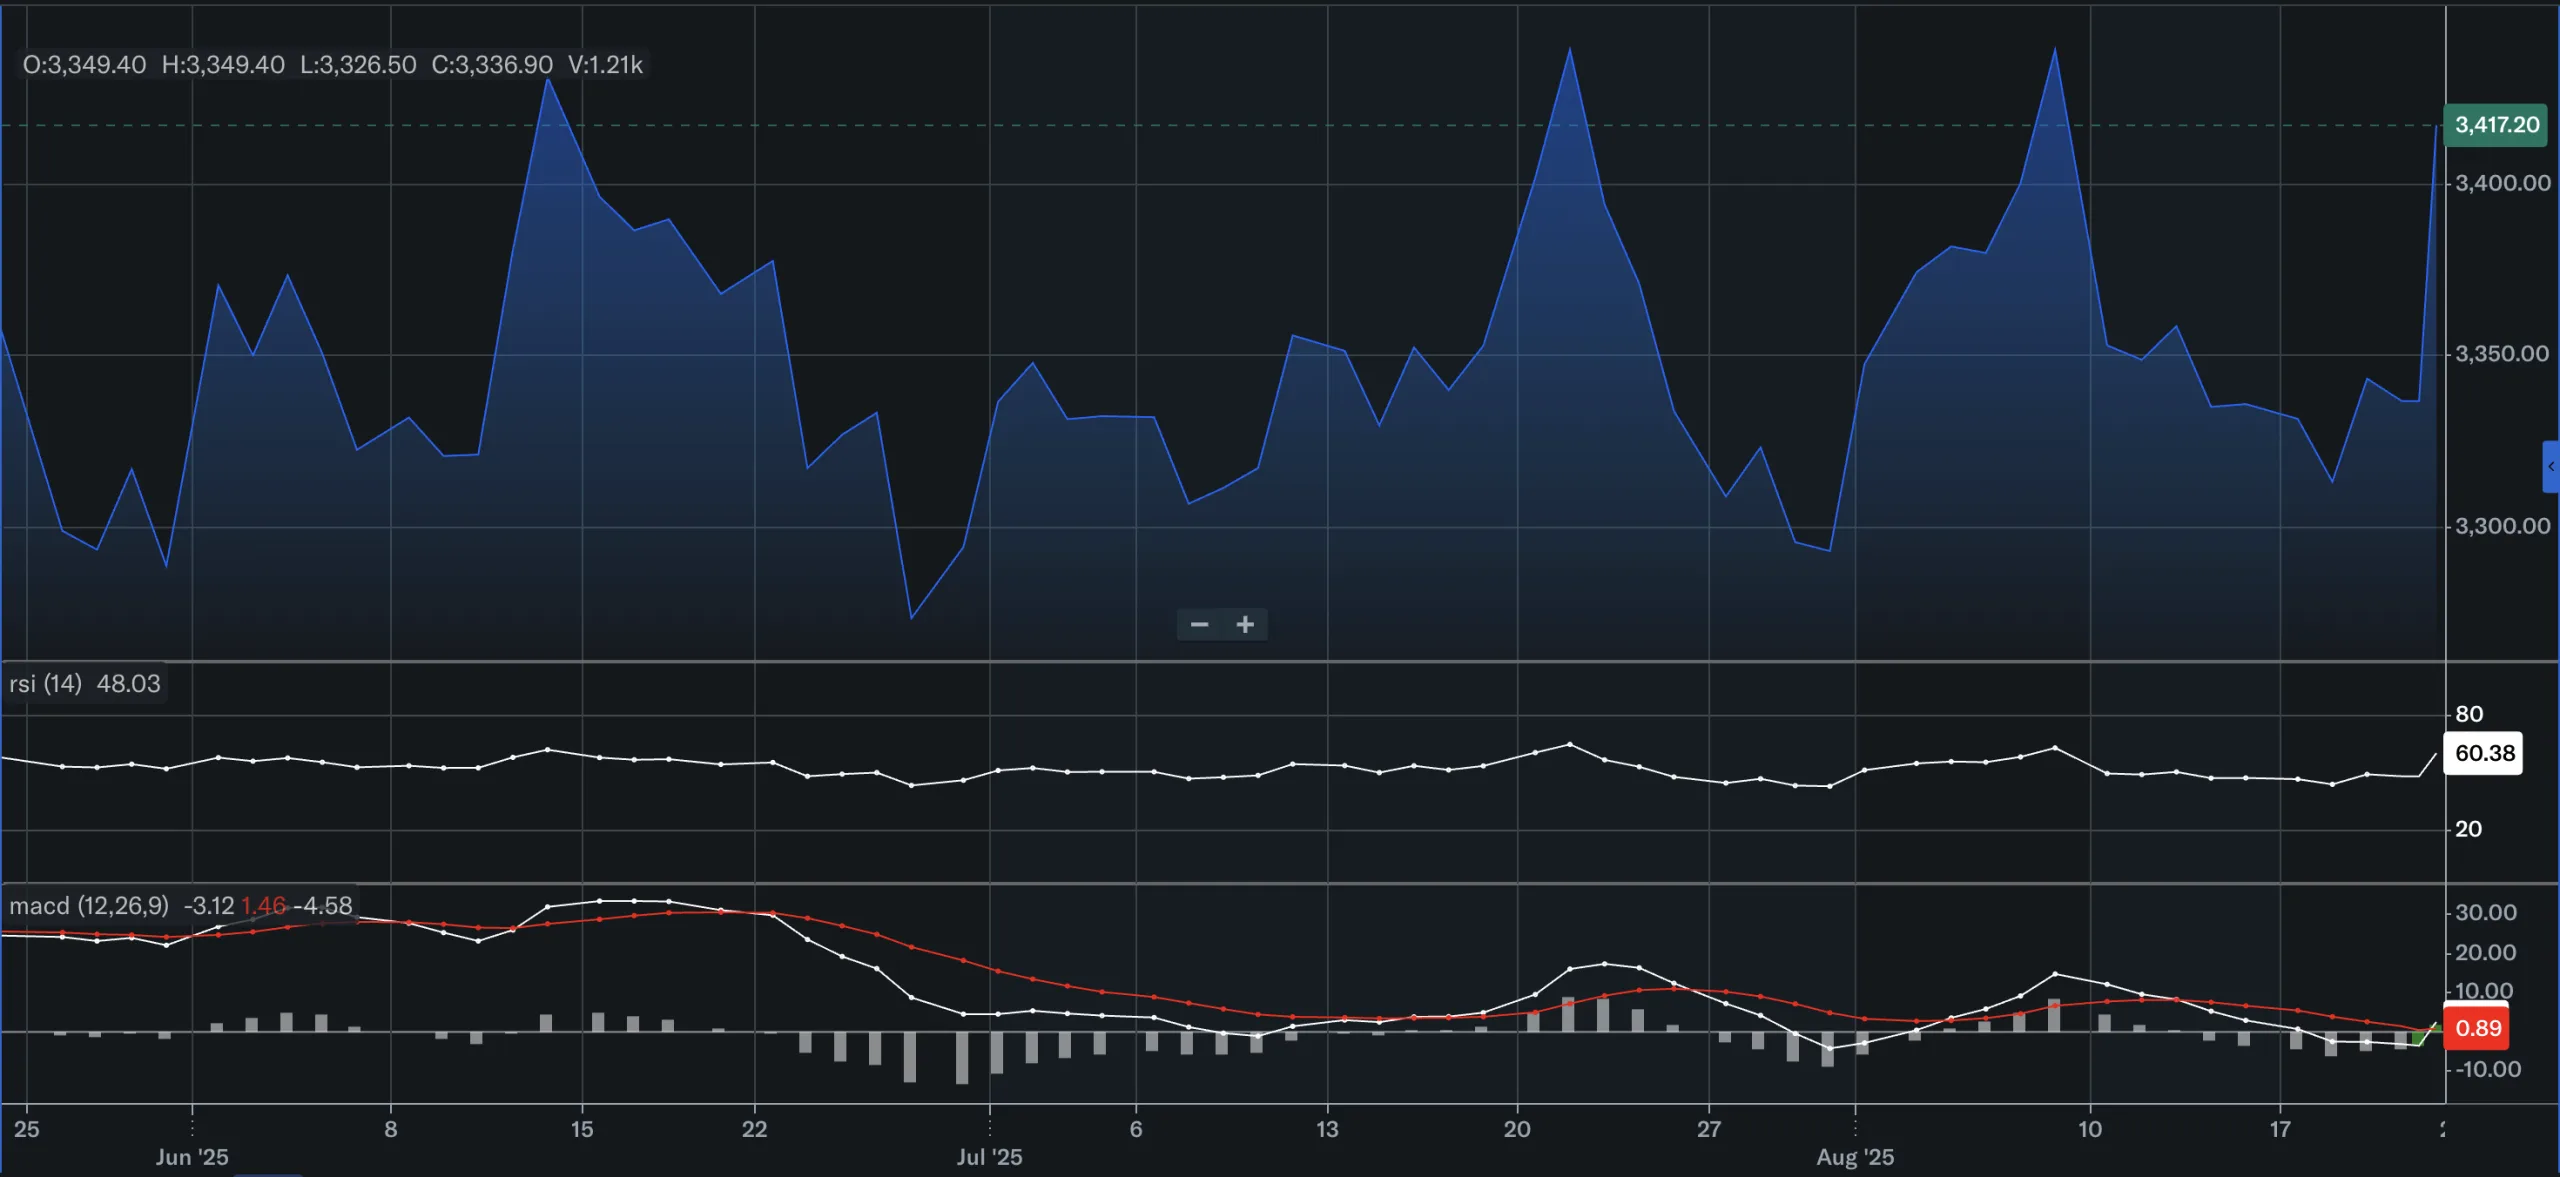
These aren’t just abstract numbers on a chart. When the RSI drops from overbought levels above 70 down toward neutral territory, it often signals that the easy money has been made. The MACD’s descent below zero is particularly concerning for bulls, as this crossover has historically preceded more significant corrections in gold prices.
Gold’s technical outlook suggests weakening bullish momentum, with the RSI at its lowest since February. This marks a significant shift from the relentless buying pressure that characterized the first quarter of the year.
Volume patterns tell a similar story of waning enthusiasm. The OBV cumulative volume has remained between $31 million and $33 million for an extended period, suggesting that neither buyers nor sellers have been willing to commit significant capital to directional bets.
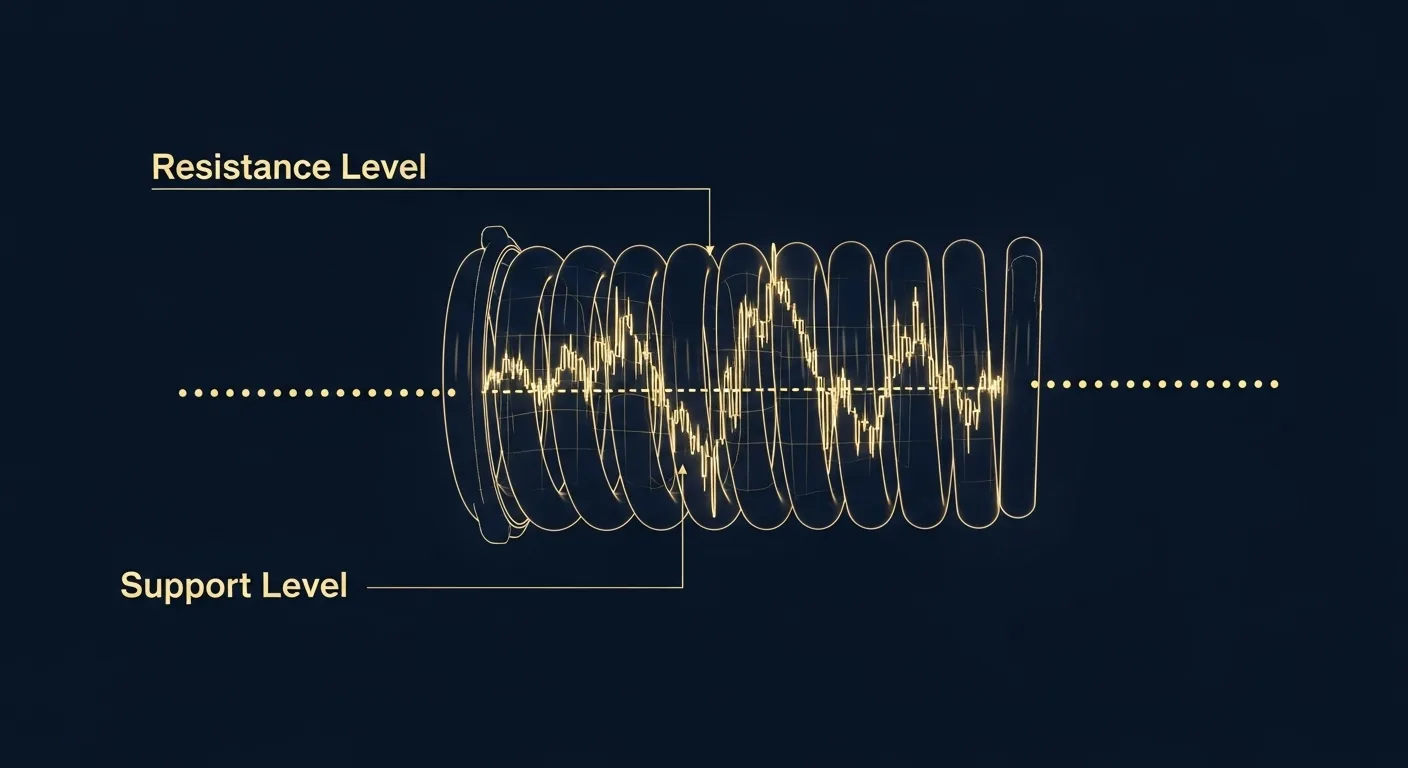
Support and Resistance: The Battle Lines Are Drawn
Technical traders live and die by support and resistance levels, and gold’s current setup offers clear battle lines for both camps. Key support lies at $2,530-$2,500, with further declines potentially targeting $2,400 and $2,300. These aren’t arbitrary numbers; they represent previous resistance levels that should, in theory, act as floors during any pullback.
On the upside, resistance at $2,900 could limit gains, though the more immediate ceiling appears to be in the $3,400-$3,450 range where selling has repeatedly emerged over the past several weeks.
The fact that gold has respected these levels so precisely suggests that algorithmic trading systems and technical traders are increasingly dominating short-term price action. This creates a self-fulfilling prophecy where breaks of key levels can trigger cascading moves in either direction.
The Macro Context: Why This Time Might Be Different
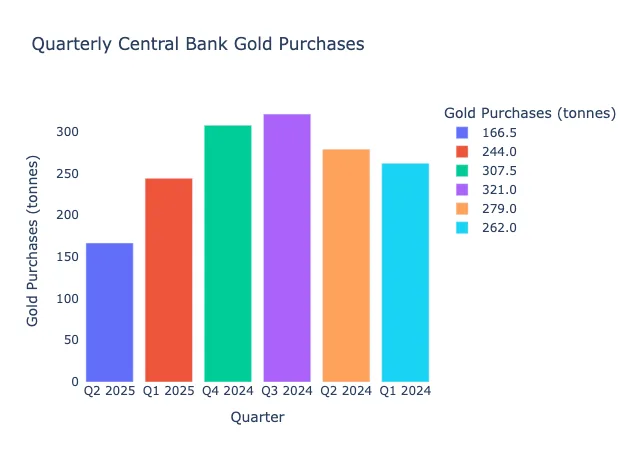
While the technical picture suggests caution, the fundamental backdrop for gold remains remarkably supportive. A primary driver of this strength is the continued and substantial purchasing by global central banks, which signals a strategic shift in reserve management.
In the second quarter of 2025, central banks added a net 166 tonnes of gold to their official reserves, demonstrating a sustained appetite for the precious metal. This follows a strong first quarter where 244 tonnes were purchased, underscoring a consistent trend of diversifying away from the US dollar and into hard assets. This is not retail speculation driving prices; it is sovereign wealth making strategic, long-term allocations. When central banks, particularly those in emerging markets, view gold as an essential component of their reserves, it creates a formidable floor under prices that was less prevalent in previous market cycles.
The geopolitical landscape adds another significant layer of support. Key factors fueling gold’s price rise include the specter of US tariffs, persistent geopolitical uncertainty, and recent stock market volatility. These are not transitory concerns that will disappear with the next news cycle; they represent structural shifts in the global order that could bolster gold’s safe-haven appeal for years to come.
The Dollar Dynamic: A Critical Variable
Gold’s inverse relationship with the US dollar remains one of the most reliable correlations in financial markets. Recent dollar weakness has provided a tailwind for gold, but this dynamic could shift quickly if Federal Reserve policy surprises markets.
The ongoing Federal Reserve symposium and upcoming policy decisions will be critical for gold’s near-term direction. Any hawkish surprise could strengthen the dollar and pressure gold prices, while continued dovish rhetoric would likely propel gold toward new highs.
What makes the current situation particularly interesting is that gold has held up remarkably well even during periods of dollar strength, suggesting that other factors, particularly central bank demand and geopolitical hedging, are playing increasingly important roles.
The Institutional View: Cautious Optimism
Major financial institutions remain constructive on gold despite the technical headwinds. J.P. Morgan expects prices to average $3,675/oz by the fourth quarter of 2025 and climb toward $4,000 by mid-2026. This bullish outlook is predicated on continued central bank buying and sustained investment demand.
InvestingHaven’s prediction for gold in 2025 stands at approximately $3,500 – $3,800, reflecting confidence in the metal’s long-term fundamentals despite short-term technical concerns.
However, not all analysts are equally optimistic about the immediate future. The World Gold Council suggests that gold may move sideways with some possible upside – increasing an additional 0%-5% in the second half of 2025, acknowledging the possibility of continued consolidation.
Trading the Consolidation: Strategies for Different Timeframes
For short-term traders, the current setup offers clear parameters. The range between $3,200 and $3,400 has been profitable for nimble traders willing to buy support and sell resistance. However, this strategy requires discipline and tight stop losses, as a decisive break in either direction could trigger a significant move.
Price action is showing compression, suggesting a move could happen within the coming weeks. This compression, often called a volatility squeeze, typically precedes explosive moves. The challenge is determining the direction.
Long-term investors might view any correction toward the $2,500-$2,800 range as a gift. With institutional targets suggesting significantly higher prices over the next 18 months, accumulating on weakness could prove rewarding for patient capital.
Options traders have been positioning for a breakout, with implied volatility remaining elevated despite the recent range-bound action. This suggests that market participants expect the consolidation to resolve decisively rather than continue indefinitely.
The Technical Verdict: Coiled Spring or Rolling Top?
After three months of sideways action, gold sits at a critical inflection point. The deteriorating momentum indicators and persistent resistance near $3,400 suggest that a correction could be imminent. However, the strong fundamental backdrop and institutional support argue against any dramatic collapse.
The most likely scenario appears to be a healthy correction toward the $2,800-$3,000 range, which would reset overbought conditions and provide a stronger foundation for the next leg higher. This would align with typical bull market behavior, where periodic consolidations and corrections are necessary to sustain long-term uptrends.
However, traders should remain vigilant for a decisive break above $3,450, which could trigger a momentum-driven rally toward the $3,600-$3,800 range that many institutions are targeting. Conversely, a break below $3,200 could accelerate selling toward more significant support levels.
The Risk Factors: What Could Derail the Bull Case
Several factors could disrupt gold’s long-term bullish trajectory. A surprisingly hawkish Federal Reserve, a resolution to major geopolitical tensions, or a sharp rally in the US dollar could all pressure prices. Additionally, if inflation concerns continue to moderate and real interest rates rise, gold’s appeal as an inflation hedge could diminish.
Technical damage is also accumulating. The failure to make new highs despite supportive fundamentals suggests that selling pressure is building beneath the surface. If key support levels fail to hold, technical selling could overwhelm fundamental buying, at least temporarily.
At Bullion Trading LLC, we help investors navigate both the technical and fundamental aspects of precious metals markets. Whether you’re looking to trade the current consolidation or position for the long-term trend, understanding both the charts and the broader context is essential for success in gold markets.