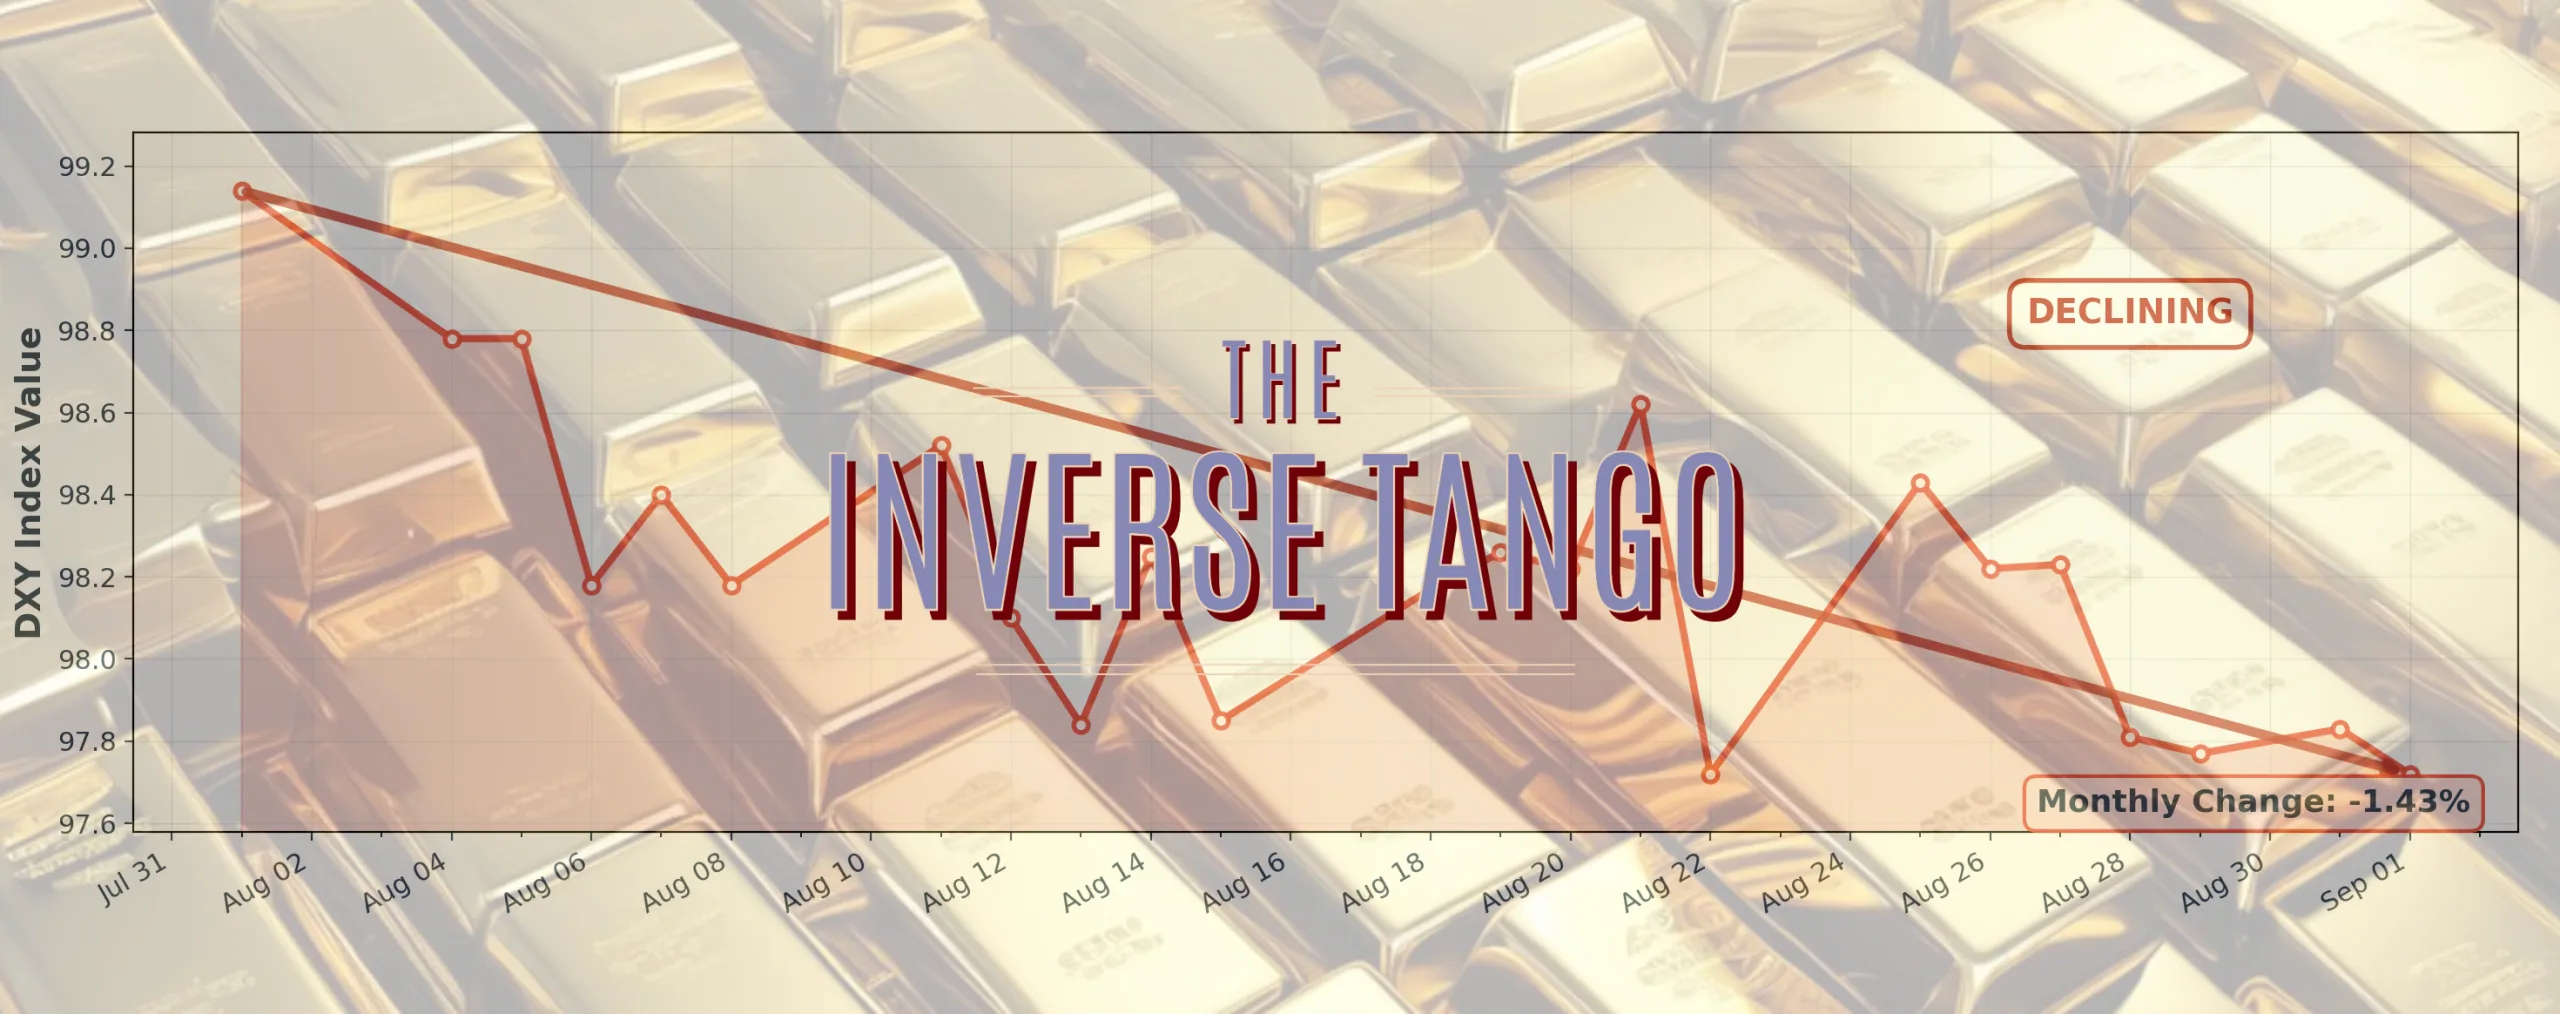
September has arrived with a familiar but powerful theme playing out across precious metals markets: as the U.S. dollar weakens, gold strengthens. This fundamental relationship, known to traders as the “inverse correlation,” is once again taking center stage as gold extends its rally for a fifth consecutive session, pressing toward the all-time high zone while the US Dollar Index (DXY) hovers near a one-month low.
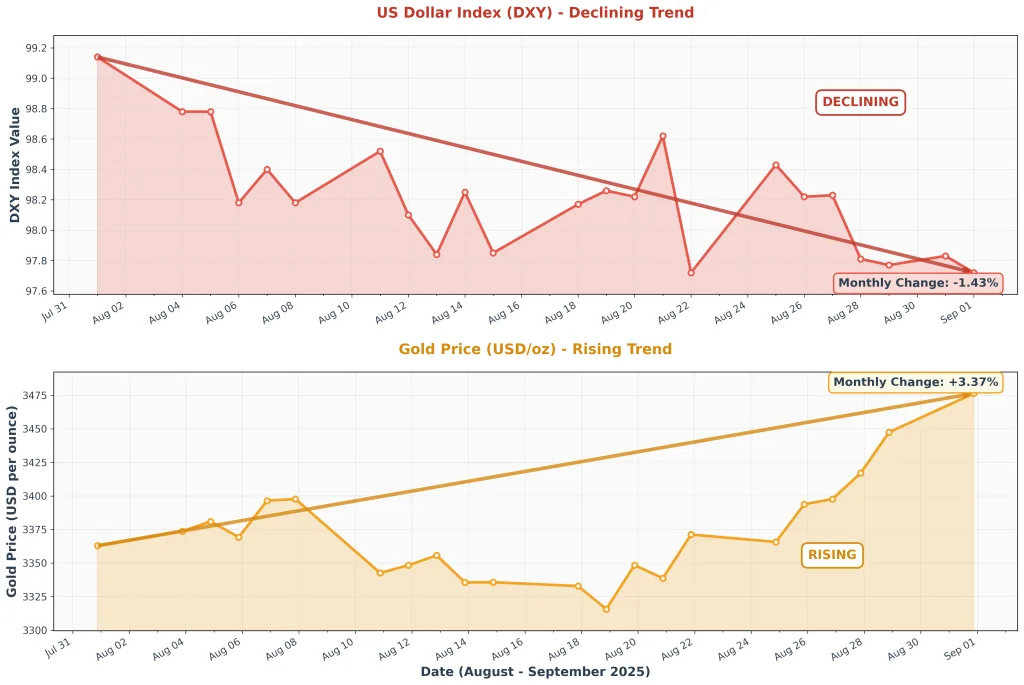
The mechanics behind this relationship aren’t just academic theory—they’re driving real money flows and creating opportunities for astute investors who understand the dynamics at play. Spot gold jumped $US41 to $US3477 an ounce in recent trading, leaving the precious metal just $US23 below its record high of $US3500, reached on April 22nd.
Why the Dollar-Gold Dance Matters Now More Than Ever
The inverse relationship between gold and the U.S. dollar operates through several interconnected channels, each amplifying the others in the current market environment. Understanding these mechanisms helps explain why gold continues to find buyers even at historically elevated levels.
Global Pricing: The Currency Conversion Effect
When the dollar weakens, gold becomes cheaper for investors holding other currencies, creating immediate demand from international buyers. This isn’t just theory—it’s mathematics in action. A European investor watching gold priced in dollars sees their purchasing power increase as the euro strengthens against the greenback.
A broadly weaker US Dollar, with the US Dollar Index (DXY) hovering near a one-month low, and September Fed cut expectations are driving demand, creating a self-reinforcing cycle where dollar weakness attracts foreign buyers, whose increased demand pushes gold prices higher, which in turn may pressure the dollar further.
The World Gold Council’s data supports this dynamic. Key factors fueled gold’s price rise: the specter of US tariffs, geopolitical uncertainty, stock market volatility and US dollar weakness. This combination of factors has created what analysts describe as a “perfect storm” for gold demand.
The Federal Reserve’s Shifting Stance: September Rate Cut Expectations
Market participants are laser-focused on the Federal Reserve’s next move, and the signals are pointing toward accommodation. Markets are pricing in nearly a 90% probability of a 25 bps rate cut at the Fed’s September 16-17 meeting, according to CME’s FedWatch tool.
This shift in monetary policy expectations isn’t happening in a vacuum. The Federal Reserve’s July 29-30 meeting minutes revealed that a couple of members actually preferred to lower the target range for the federal funds rate by 25 basis points at that meeting, reflecting the growing dovish sentiment within the committee.
[IMAGE SUGGESTION: Timeline infographic showing key Fed communications and market reactions from July through September 2025, with gold price movements overlaid]
The mechanism here is straightforward: when interest rates fall, the opportunity cost of holding gold decreases. Since gold doesn’t pay interest or dividends, lower rates make it more attractive relative to yield-bearing assets. The rate-sensitive 2-year yield remains under pressure at 3.62%, holding near its lowest level since May 1, reinforcing the market’s conviction of a September interest rate cut.
Recent Market Developments: Politics Meets Monetary Policy
The current rally gained additional momentum from unexpected political commentary. According to IG market analyst Tony Sycamore, spot gold jumped $US41 to $US3477 an ounce after Trump claimed US prices are “WAY DOWN” with virtually no inflation. These comments highlighted concerns about Federal Reserve independence and potential policy shifts.
The market’s reaction was swift and telling. “The market reacted immediately to Trump’s comments, with gold benefiting from concerns over the Fed’s independence and potential policy shifts”, according to Sycamore.
This political dimension adds another layer to gold’s appeal. When investors worry about central bank independence or unconventional policy approaches, gold’s role as an asset outside the traditional financial system becomes more valuable.
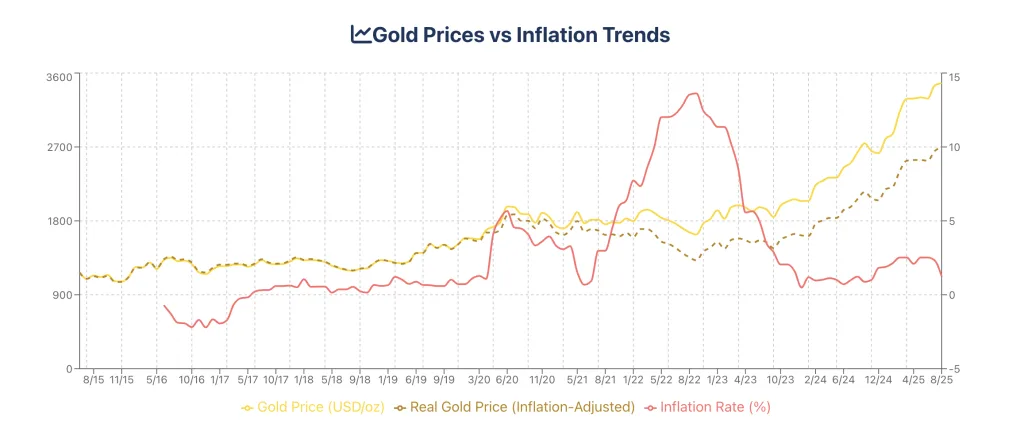
Inflation Data: Mixed Signals Creating Opportunity
Recent inflation data has provided a complex backdrop for both dollar and gold movements. The core Personal Consumption Expenditures (PCE) Price Index rose 0.3% MoM in July, unchanged from June, while the yearly rate edged up to 2.9% from 2.8%, its highest since February.
The index rose 0.3 per cent month-on-month, pushing the annual rate to 2.9 per cent, which remains above the Fed’s target of 2 per cent. This persistent inflation creates a delicate balancing act for the Federal Reserve and reinforces gold’s traditional role as an inflation hedge.
Safe-Haven Demand: Geopolitical Tensions Fuel Defensive Positioning
Beyond the dollar-denominated mechanics, gold’s safe-haven status continues to attract investors facing an uncertain global landscape. Beyond monetary policy expectations, bullion continues to attract safe-haven demand as uncertainty mounts over US trade policy and the Fed’s independence.
Legal developments have added to this uncertainty. A federal appeals court ruled that most of US President Donald Trump’s global tariffs were unlawful, saying he had overstepped his authority under the International Emergency Economic Powers Act (IEEPA). While the levies will remain temporarily in place under a stay until mid-October, this ruling creates additional policy uncertainty.
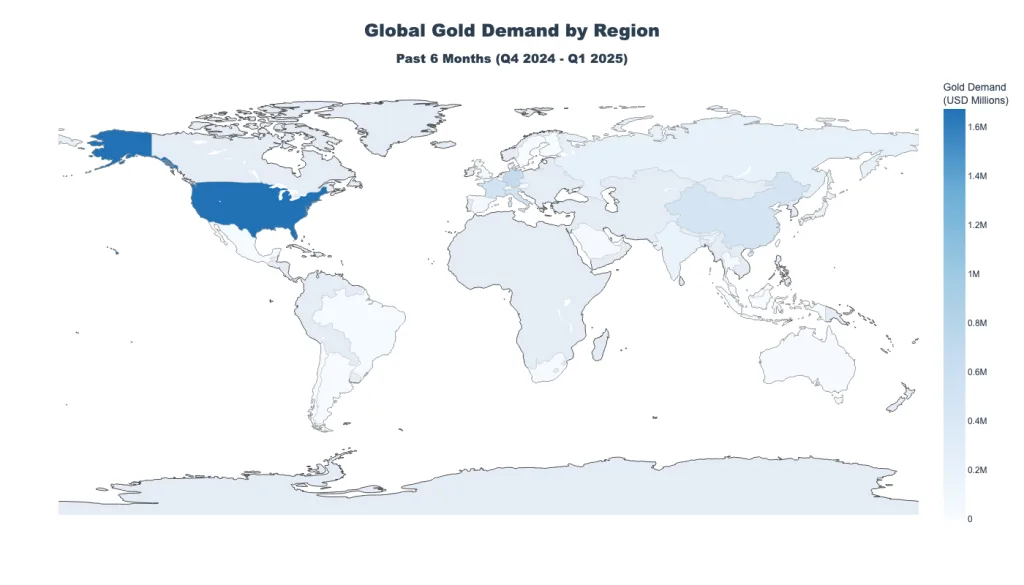
Central Bank Buying: The Institutional Foundation
One of the most significant structural supports for gold comes from central bank buying, which provides a steady demand base regardless of short-term market fluctuations. This institutional demand has been a key factor in gold’s resilience at elevated price levels.
Central banks understand the inverse relationship between their own currencies and gold, and many are actively diversifying their reserves. When the dollar weakens, it makes gold relatively cheaper for central banks holding dollars, while also reducing their dollar exposure—a double benefit for those seeking portfolio diversification.
Technical Analysis: The Charts Confirm the Narrative
From a technical perspective, the inverse relationship between gold and the dollar is playing out clearly on the charts. Gold remains firmly in a bullish structure after consolidating for several months beneath the all-time high of $3,500 marked on April 22.
The technical setup supports further upside potential. A sustained daily close above this level would open the door to uncharted territory, potentially extending gains toward the $3,550–$3,600 zone in the short term.
Meanwhile, momentum indicators reinforce the bullish bias, with the Relative Strength Index (RSI) hovering near 69, close to overbought levels, indicating strong but not yet exhausted buying pressure.
Market Positioning: How Traders Are Playing the Relationship
Professional traders and institutional investors are positioning for continued dollar weakness and corresponding gold strength. Despite the sticky core reading, traders continue to price in nearly a 90% probability of a 25 bps rate cut at the Fed’s September 16-17 meeting, according to CME’s FedWatch tool.
This positioning creates its own momentum as market participants front-run expected policy changes. When enough traders expect dollar weakness, their positioning can become self-fulfilling as they sell dollars and buy alternatives like gold.
Options Markets Signal Continued Volatility
Options markets are pricing in continued volatility around both Fed policy and the dollar-gold relationship. High implied volatility suggests that market participants expect significant moves in either direction, but the preponderance of evidence points toward continued dollar weakness and gold strength.
Economic Data to Watch: The Roadmap Ahead
This week’s releases, JOLTS Job Openings (July) on Wednesday, weekly Initial Jobless Claims on Thursday, and Friday’s Nonfarm Payrolls (NFP) will be pivotal in shaping expectations for a September rate cut by the Fed.
The employment data carries particular significance because it directly influences Fed policy deliberations. While the uptick in core inflation muddies the monetary policy outlook, investors are turning their attention to the labor market, where signs of cooling hiring momentum and softer wage growth suggest a bigger risk to the economy than lingering inflation pressures.
Additional data points to monitor include:
- ISM Manufacturing PMI on Tuesday and ISM Services PMI on Thursday
- Federal Reserve communications and speeches
- International trade and tariff developments
- Geopolitical events that could affect safe-haven demand
Investment Implications: Positioning for the Inverse Relationship
The current environment presents several considerations for precious metals investors looking to capitalize on the dollar-gold inverse relationship:
Dollar-Cost Averaging vs. Tactical Timing
For investors seeking exposure to this relationship, the approach matters. The strength of the inverse correlation suggests that systematic accumulation during periods of dollar strength could provide attractive entry points, while dollar weakness creates favorable conditions for holding existing positions.
The key is understanding that this relationship, while historically reliable, can experience periods of divergence during extreme market stress or when other factors dominate pricing.
Physical vs. Paper Gold Exposure
Trading conditions remain thin with United States (US) markets closed for Labor Day, highlighting how market structure can affect short-term price discovery. For investors focused on the longer-term inverse relationship, physical gold provides more direct exposure without the complexities of financial market intermediation.
| Gold Investment | PHYSICAL GOLD | GOLD ETFs | GOLD MINING STOCKS |
|---|---|---|---|
| ✅ ADVANTAGES | 1- Direct ownership – No counterparty risk 2- Tangible asset security 3-Crisis resilience & store of value 4- Ultimate inflation hedge 5- Privacy and confidentiality 6- No management fees 7- Globally recognized & accepted 8- Portfolio insurance during crisesLD | 1- High liquidity – Trade like stocks 2- Low transaction costs 3- No storage requirements 4- Fractional ownership possible 5- Easy portfolio integration 6- Transparent pricing 7- Professional management 8- Market hours trading flexibility | 1- Leveraged exposure to gold prices 2- Potential for dividend income 3- High liquidity in stock markets 4- Growth potential beyond gold prices 5- Management expertise and efficiency 6- Standard equity taxation benefits 7- Professional analysis available 8- Diversification within mining sector |
| ❌ DISADVANTAGES | 1- Storage costs & insurance (1-2% annually) 2- No yield generation or dividends 3- Higher transaction costs & premiums 4- Liquidity challenges in extreme conditions 5- Authentication and verification needed 6- Tax as collectible (up to 28%) 7- Theft risk if stored at home 8- Limited accessibility for trading | 1- Annual expense ratios (0.25-0.40%) 2- Counterparty risk dependency 3- No physical possession possible 4- Trading limited to market hours 5- Tax as collectible for some ETFs 6- Management and structure risk 7- Potential tracking errors 8- Corporate action dependencies | 1- Company-specific operational risks 2- Higher volatility than gold 3- Management and governance risks 4- Environmental & regulatory risks 5- Geopolitical risks in mining regions 6- May not correlate with gold in crises 7- Labor strikes and union issues 8- Capital allocation decisions impact |
| 📊 KEY METRICS | Liquidity: Medium Volatility: Medium Expense Ratio: 0% (storage costs apply) Recommended Allocation: 70% of gold allocation | Liquidity: Very High Volatility: Medium Expense Ratio: 0.25-0.40% Recommended Allocation: 30% of gold allocation | Liquidity: High Volatility: High Expense Ratio: 0% (stock trading costs) Recommended Allocation: 10-15% of gold allocation |
NOTE: For further insights into cold investment, head over to our Learning Center.
Looking Forward: Catalysts and Risks
Several factors could intensify or disrupt the current dollar-gold inverse relationship:
Catalysts for Continued Dollar Weakness/Gold Strength:
- Fed rate cuts exceeding current market expectations
- Continued geopolitical tensions requiring safe-haven positioning
- Further legal challenges to current trade policies
- Central bank diversification away from dollar reserves
Potential Disruptions:
- Economic data suggesting stronger growth than expected
- Hawkish surprises from Federal Reserve communications
- Resolution of major geopolitical tensions
- Technical breakdown in gold’s chart pattern
The Institutional Outlook
Major financial institutions remain constructive on gold’s outlook. Gold prices are expected to average $3,675/oz by the fourth quarter of 2025 according to J.P. Morgan Research, suggesting continued confidence in the precious metal’s trajectory despite current elevated levels.
This institutional support provides a foundation beneath current prices and suggests that any significant weakness might attract value-oriented buyers.
The Historical Context: Lessons from Previous Cycles
The current dollar-gold inverse relationship echoes patterns from previous monetary policy cycles, but with important differences. Today’s environment features:
- Higher absolute debt levels globally
- More complex geopolitical tensions
- Greater central bank coordination (and potential conflicts)
- More sophisticated financial markets and instruments
These factors suggest that while the basic inverse relationship remains valid, its magnitude and timing may differ from historical precedents.
The Bottom Line for Precious Metals Investors
The weakening U.S. dollar is providing fundamental support for gold prices as we move through September 2025. At the time of writing, XAU/USD is trading around $3,470 in the European session, easing from an intraday high of $3,489 marked during Asian hours and coming just shy of the all-time high at $3,500.
The combination of Federal Reserve policy expectations, persistent geopolitical tensions, and technical momentum suggests this inverse relationship could continue driving gold prices higher in the near term. For investors seeking portfolio diversification or hedging against currency debasement, the current environment reinforces gold’s historical role as a store of value and safe-haven asset.
However, markets rarely move in straight lines, and the inverse relationship between gold and the dollar, while historically reliable, can experience periods of disruption. Successful investing requires understanding both the fundamental drivers and the potential risks to any investment thesis.
At Bullion Trading LLC, we help clients navigate these complex market dynamics and understand how monetary policy, currency movements, and geopolitical developments affect precious metals markets. Whether you’re looking to hedge against dollar weakness or capitalize on gold’s safe-haven appeal, understanding the mechanics behind the inverse tango between gold and the dollar remains essential for informed investment decisions.