Just over two weeks into the 2026 Iran war, Brent crude is trading near $100 a barrel. The Strait of Hormuz is effectively closed. Roughly 20 million barrels per day of global oil supply are trapped, and physical markets are flashing stress signals that paper markets have so far largely ignored. Iran has threatened $200 oil. Reuters says that figure is not far-fetched.
If you own gold or silver, or you are thinking about buying, the obvious question is whether this oil price spike will push precious metals higher. It sounds like it should. Oil shocks create inflation, inflation drives investors to gold, gold goes up. That is the story most people tell. But the actual history is more complicated and, once you dig into it, more useful for anyone trying to make smart decisions with their money right now.
The short version: oil shocks do not reliably drive gold and silver. What drives precious metals is the economic damage that sometimes follows. The distinction matters enormously, and the current moment makes it worth understanding.
The Conventional Wisdom and Why It Falls Short
The idea that rising oil prices automatically push gold higher has a certain logic to it. Energy costs feed into the price of nearly everything, from groceries to shipping to manufacturing. When crude doubles in a matter of weeks, consumer prices follow, and gold has historically served as a hedge against inflation. So the mental shortcut becomes: oil spike equals inflation, inflation equals gold rally.
But this chain of reasoning skips several important links. Not every oil shock produces lasting inflation. Not every bout of inflation triggers a gold rally. And the biggest precious metals bull markets in history did not begin with oil at all. They began when the broader economy started to deteriorate and central banks responded by loosening monetary policy. The oil is often just the match. The recession is the fire.
1973: The Embargo That Confirmed a Trend Already in Motion
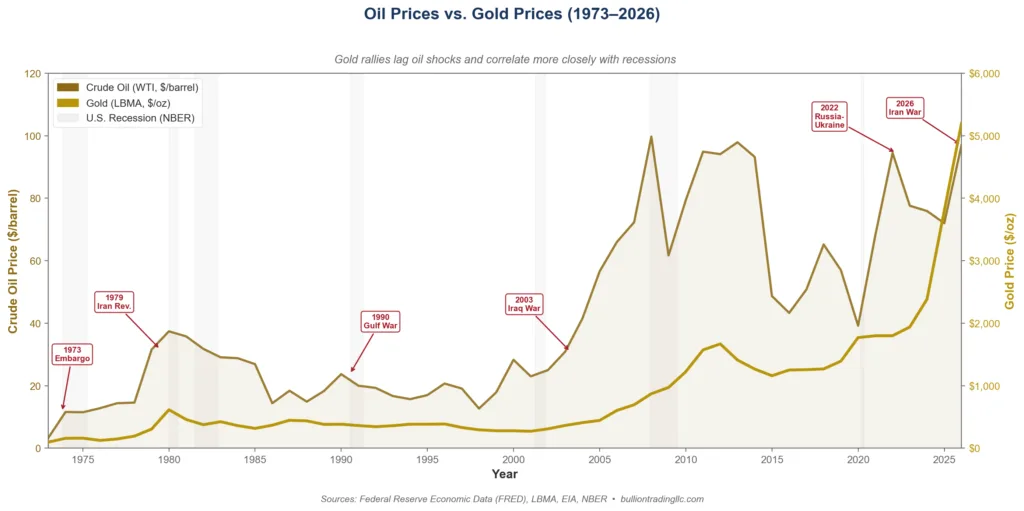
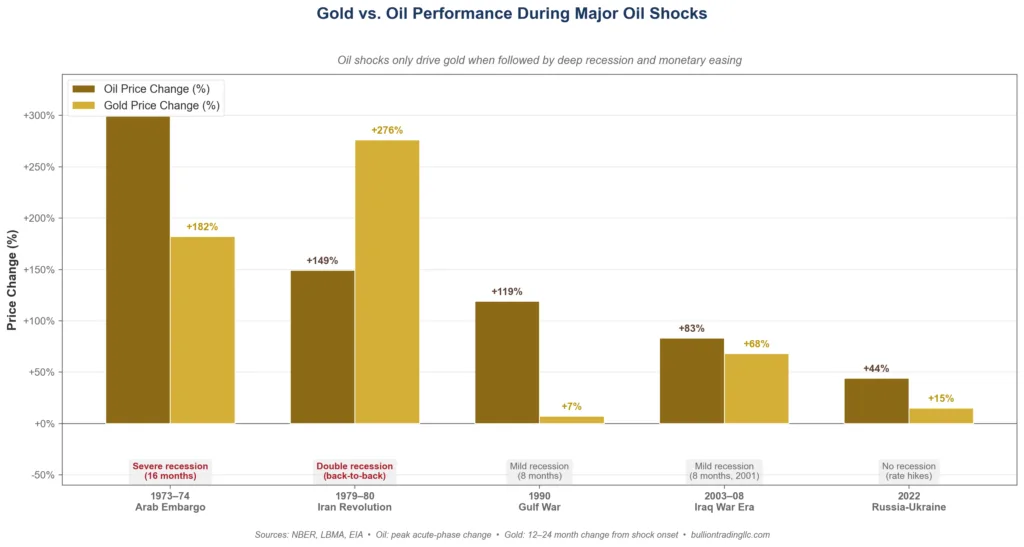
The 1973 Arab oil embargo is the textbook starting point for any discussion about oil shocks. When OPEC cut off exports to the United States in October 1973, crude nearly quadrupled, rising from about $2.90 to $11.65 per barrel. The economy tipped into a severe recession from November 1973 through March 1975, and gold surged. By the end of the decade, gold had climbed past $450 an ounce.
But here is the part that often gets left out: gold was already in a powerful bull market before the first barrel of oil was embargoed. President Nixon had closed the gold window in August 1971, ending the dollar’s convertibility to gold and effectively devaluing the currency. Gold, which had been fixed at $35 an ounce under the Bretton Woods agreement, was already climbing well before OPEC acted. The oil shock accelerated inflation and tipped the economy into recession, which gave gold additional fuel. But the rally did not start with oil. It started with monetary policy.
What actually mattered for gold in the mid-1970s was the combination of a weakening dollar, rising inflation that the Federal Reserve was slow to contain (Fed Chair Arthur Burns had already described inflation as persistent before the embargo), and a deep recession that forced policymakers to prioritize growth over price stability. The oil shock was the catalyst for the recession, not the direct catalyst for gold.
1979: When Everything Went Wrong at Once
The 1979 Iranian Revolution produced the second great oil shock. Iranian production collapsed, global supply tightened, and crude prices more than doubled. Inflation was already running hot from the first oil shock, and this second blow pushed it into double digits. Gold responded explosively, surging to a then-record $850 per ounce in January 1980.
This is the episode that most people point to when they argue that oil shocks drive gold. And the correlation is real. But look closer: the U.S. entered a recession in January 1980. The Federal Reserve, now under Paul Volcker, eventually raised interest rates to nearly 20% to break the inflation cycle. What made gold run was not simply the price of oil. It was the fear that the economic system itself was breaking down. Inflation was out of control, the dollar was losing purchasing power month by month, and investors were desperate for something that could not be printed or devalued by a central bank.
When Volcker finally succeeded in crushing inflation through those extreme rate hikes, gold entered a bear market that lasted roughly two decades. Oil prices fell back too, but gold kept falling long after oil stabilized. If oil shocks were the primary driver of gold, the metal should have held its value once crude settled. It didn’t. The relationship was never that direct.
1990: The Gulf War Oil Spike That Gold Completely Ignored
The 1990 Gulf War is the most important case study for understanding why oil does not automatically move metals. When Iraq invaded Kuwait in August 1990, oil prices more than doubled over the following weeks. It was a textbook supply shock with genuine disruption to global energy markets. If the “oil up, gold up” theory held, this should have been a major rally for precious metals.
It wasn’t. Gold barely budged and actually continued the grinding decline it had been on since its 1980 peak. Silver was even weaker. The U.S. did enter a recession from July 1990 through March 1991, but it was a mild one, and the economic expansion that followed was robust enough to keep interest rates relatively high and the dollar relatively strong. Neither gold nor silver found much reason to rally.
This episode alone should make any investor skeptical of the simple oil-equals-gold narrative. The oil shock was real. The geopolitical crisis was severe. And precious metals went essentially nowhere. What was missing was the kind of systemic monetary and economic deterioration that drives sustained demand for hard assets. Without a deep recession, without aggressive monetary easing, without genuine fear about the stability of the financial system, oil shocks by themselves just do not move metals in a meaningful or lasting way.
2003 and 2022: Two More Data Points That Support the Pattern
The 2003 Iraq War pushed oil prices higher, but gold was already in the early stages of a new bull market that had begun after the dot-com bust and the 2001 recession. The Federal Reserve had slashed rates to 1% and was actively flooding the system with liquidity. Gold’s rally through the 2000s was driven by easy money, a weakening dollar, and growing concern about fiscal deficits. The oil shock from the Iraq War added fuel, but the underlying driver was monetary expansion in the aftermath of recession.
The 2022 Russia-Ukraine oil shock tells a similar story but in reverse. Oil spiked to roughly $130 a barrel, and gold briefly touched $2,070 on the initial panic. But the rally did not hold. The global economy was still expanding after the massive COVID-era stimulus, and central banks were pivoting to aggressive rate hikes to fight inflation. The Fed raised rates at the fastest pace in decades. Gold pulled back and spent much of 2022 and early 2023 trading below its March spike. Oil was expensive, but the economic backdrop simply did not support a sustained gold rally at that moment.
Taken together, these five episodes tell a consistent story. Gold and silver respond to oil shocks only when the shock is severe enough to push the economy into recession, force central banks into easing, and create serious concern about the long-term health of the monetary system. The oil by itself is not the signal. The recession that follows is.
The Business Cycle Is What Actually Matters
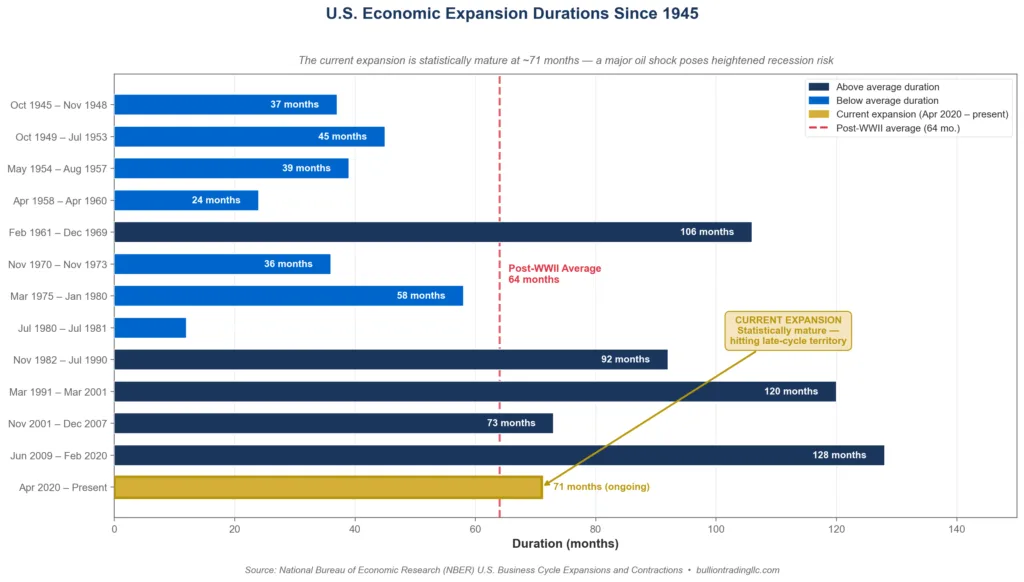
This brings us back to the framework that cuts through the noise. According to the National Bureau of Economic Research, the average post-World War II economic expansion has lasted about 64 months, or roughly five and a half years. The current expansion began in April 2020, which puts us approximately six years into the cycle as of March 2026.
That does not mean a recession is imminent. Some expansions have lasted much longer. The 1991-2001 expansion ran for a full decade. But it does mean the economy is statistically mature, and a major external shock, like a war that closes the Strait of Hormuz and removes 20 million barrels per day from global supply, becomes far more dangerous when it hits a late-cycle economy than when it hits one in the early stages of expansion.
Analysts are already raising the alarm. Reuters reported on March 2 that the Iran conflict poses new risk to U.S. economic resilience. Oxford Economics warned of potential global inflation increases and recession risk if the supply disruptions persist. The International Energy Agency has announced plans for a record strategic petroleum reserve release of 400 million barrels, a crisis-level response that only happens when policymakers are genuinely worried.
What This Means for Gold and Silver Right Now
If history is the guide, the question for precious metals investors is not whether oil is at $100. It is whether the current oil shock will be severe enough and last long enough to tip the economy into recession. And the answer to that question depends on things that are genuinely uncertain: how long the Strait of Hormuz remains closed, whether the conflict escalates or winds down, how effectively the IEA’s reserve release offsets lost supply, and how consumers and businesses absorb the hit to their energy costs.
What we do know is that the conditions for a recession-driven precious metals rally are more present today than they have been in years. The economic expansion is mature. The oil shock is severe by any historical standard. Central banks face the awful choice between fighting inflation and supporting growth. And the physical gold market has been running tight for months, with central banks continuing to accumulate at elevated rates and lease rates signaling persistent supply stress.
None of this guarantees that gold and silver will surge tomorrow. The 1990 example proves that oil shocks can happen without moving metals at all. But the setup today looks a lot more like 1973 and 1979 than it does like 1990 or 2022. A late-cycle economy absorbing a massive energy shock with central banks caught between competing priorities is exactly the kind of environment that has historically produced the most powerful precious metals rallies.
For investors, the practical takeaway is straightforward. Do not buy gold because oil is up. Buy gold because oil is up, the economy is late-cycle, the monetary system is under stress, and history shows that this specific combination matters far more than any single commodity price. If the recession comes, gold and silver have consistently been among the first assets to benefit. If it doesn’t, the metals may consolidate but are unlikely to collapse given the structural demand backdrop.