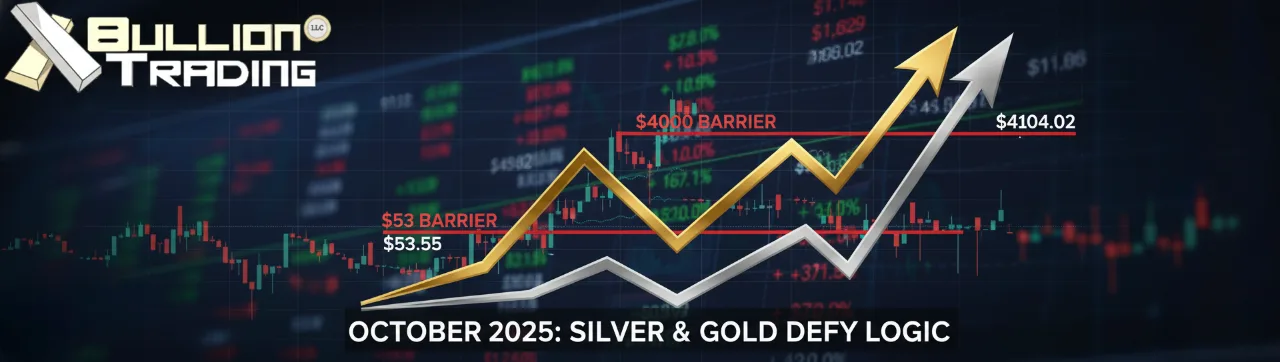
The precious metals market reached historic milestones in October 2025, defying traditional technical indicators and challenging conventional wisdom about market behavior. Gold broke through the $4,000 barrier, marking its 45th record high of the year and gaining more than 50% year-to-date, while silver surged past $53 per ounce after gaining approximately 70% this year, setting a new all-time high after 45 years.
Record Highs Challenge the Charts
Gold broke through $4,104.02 per ounce on October 13, 2025, while silver surged past $53.55 per ounce. The dual rally has captivated investors, with gold gaining more than 50% year-to-date and silver up approximately 70%. According to World Gold Council data, gold’s 2025 performance now rivals the legendary 1979 bull run, while silver’s move represents its first new all-time high in 45 years.
Technical analysts are flashing red signals across the board. The Relative Strength Index (RSI) for both metals has exceeded 70, the traditional threshold for overbought conditions, and in gold’s case, has climbed above 80. Both precious metals are trading more than 20% above their 200-day moving averages, a deviation that typically signals an imminent correction.
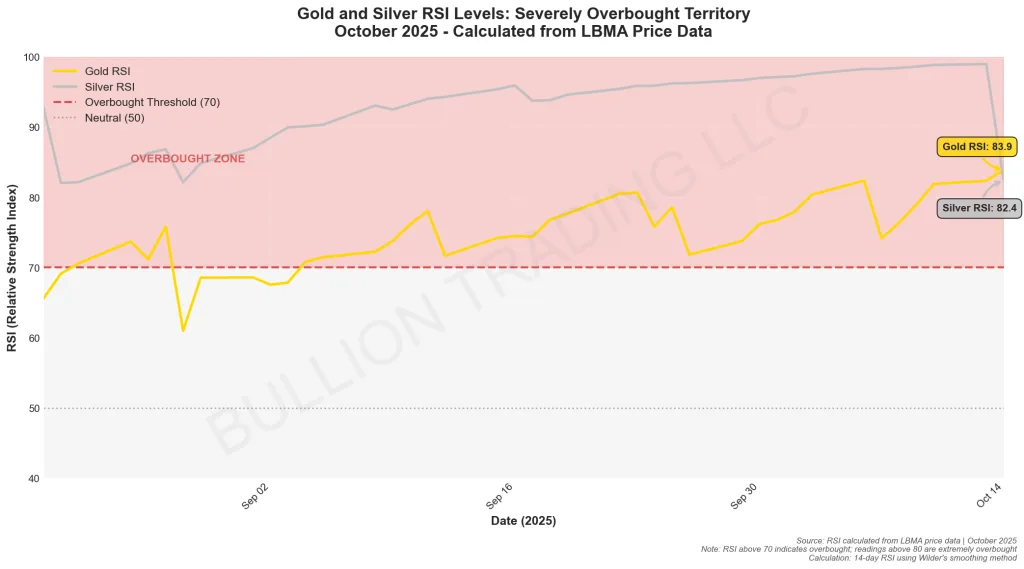
In their latest precious metals update, Heraeus analysts warned that both gold and silver have entered “severely overbought territory” with silver’s “near-vertical rally” triggering “a series of cautionary signals across both technical and structural fronts.” The firm noted that “gold, platinum and palladium have all also entered severely overbought territory, extending well beyond their 200-dma.” Volatility across the precious metals complex has reached multi-year highs.
Technical Signals Flash Red, But the Story Runs Deeper
Chartists have good reason for concern across both metals. Gold’s RSI exceeded 80, an extreme reading, while silver’s RSI has remained deeply overbought since August 2025. Gold has posted eight consecutive weeks of gains, an unusual but not unprecedented streak. Both metals are trading more than 20% above their 200-day moving averages. Heraeus noted that “readings this high have typically been followed by corrections and sometimes more significant bear markets.”
The futures market structure also reflects extreme conditions in both metals. Silver’s forward curve has slipped into steep backwardation extending out to 2027, with the December 2025 contract trading at a discount of more than 4% to the spot price. One-month silver lease rates spiked to around 8% in early October, highlighting severe physical market tightness. Gold’s market structure, while less extreme, also shows signs of stress as investment demand surges.
However, experienced precious metals investors recognize that technical indicators operate differently during periods of fundamental paradigm shifts. When the market’s primary motivation shifts from profit-taking to capital preservation, affecting both gold and silver simultaneously, momentum can persist far longer than chartists expect. The synchronized rally across both metals suggests deeper macro forces at work.
For insights into how precious metals respond during major monetary policy shifts, see our analysis on how gold prices react to Fed policy changes.
Fundamentals Overpower Technicals
The current gold and silver rally is fundamentally different from previous speculative bubbles because it’s driven by a loss of confidence in fiat currency systems and concerns about sovereign debt sustainability. Both metals are benefiting from the same macro forces, though each has unique supply-demand dynamics. As Juan Carlos Artigas, Global Head of Research at the World Gold Council, stated in a January 2025 interview, the sovereign debt issue represents “the black swan for 2025.”
Fear of Fiat Debasement
The U.S. government entered its second shutdown of 2025 in October, as reported by Bloomberg, with the White House Budget Office preparing to “ride out” the political impasse. This dysfunction, combined with fiscal year 2025 deficit projections exceeding $2 trillion, has undermined confidence in the dollar’s stability.
Adding fuel to safe-haven demand for both gold and silver, escalating U.S.-China trade tensions reached a critical point when President Trump threatened to impose a 100% tariff on China “over and above any Tariff that they are currently paying” from November 1, 2025. According to Business Insider, this announcement triggered the S&P 500’s steepest decline since April, dropping 2.7% in a single session. Investors rushed to precious metals as traditional safe havens.
The political environment has created what Citadel CEO Ken Griffin described as a “really concerning” development: investors are beginning to view gold, and increasingly silver, as safer assets than the U.S. dollar itself. This fundamental shift in market psychology affects both metals and cannot be adequately captured by technical indicators alone.
Tight Physical Supply
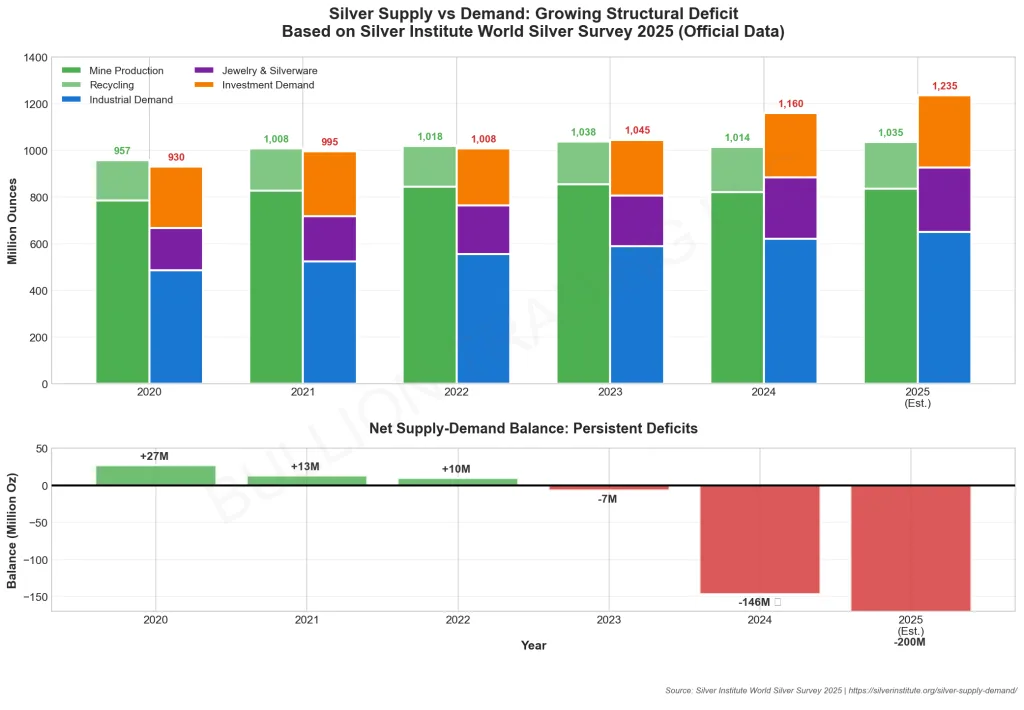
Beyond geopolitical concerns, the physical precious metals market is experiencing unprecedented tightness. Silver inventories at the London Bullion Market Association (LBMA) have fallen to 790 million ounces as of September 2025, down more than 30% from their 2021 peak, according to Business Insider data.
Simultaneously, industrial demand continues to climb, driven by solar panel manufacturing and electronics production. Silver’s recent inclusion on a draft U.S. critical minerals list has intensified speculation about strategic stockpiling, further constraining available supply.
This supply-demand imbalance triggered an epic short squeeze in October 2025. Traders who had bet on falling silver prices were forced to buy at higher prices or rent physical metal at inflated interest rates to limit losses. The scramble to close short positions accelerated the rally and pushed borrowing costs for physical silver to multi-year highs.
Under-Allocated Institutions
Perhaps the most compelling evidence that this rally has room to run comes from institutional positioning data. Despite gold’s spectacular performance, the Bank of America Global Fund Manager Survey conducted in September 2025 revealed shocking underexposure among professional investors.
The survey polled 165 fund managers overseeing $426 billion in assets. Results showed that 39% of respondents held zero gold allocation in their portfolios, a figure that represents significant untapped investment potential. Gold exposure among surveyed managers averaged just 2.4% of assets, while only 6% maintained allocations of 8% or more.
Ryan Detrick, Chief Market Strategist at Carson Research, commented on the findings: “It is astonishing, but it also demonstrates that we are still far from a gold frenzy.” According to a Futunn Finance report, this indicates that speculative enthusiasm for gold has yet to fully materialize, suggesting substantial upside potential remains.
Institutional gold allocations remain near historical lows despite record prices, with 39% of fund managers holding zero exposure, Bank of America Global Fund Manager Survey, September 2025. Chart based on verified survey data.
The World Gold Council’s October 2025 analysis reinforces this view. Global gold ETFs have added 634 tonnes year-to-date, bringing total holdings to 3,857 tonnes, still 2% below the November 2020 peak of 3,929 tonnes. The current accumulation phase appears nascent compared to previous bull runs, which averaged 221 to 253 weeks and added between 1,823 and 2,341 tonnes.
As of October 2025, the current run has lasted just 74 weeks, with holdings up 788 tonnes. Compared to historical averages, this represents only 30-40% of typical accumulation phases, suggesting the rally may be in its “early innings” rather than approaching exhaustion.
Lessons from History
The precious metals market has experienced extended overbought periods during previous episodes of monetary stress and inflation. The 1979-1980 period saw both gold and silver remain technically overbought for months as inflation surged above 13% and geopolitical tensions escalated following the Iranian Revolution and Soviet invasion of Afghanistan. Silver spiked from $6 to $50 per ounce while gold surged from $200 to $850, both staying overbought far longer than technical models predicted.
Similarly, gold stayed overbought from 2008 through 2011 during the post-financial crisis period, ultimately gaining 166% from trough to peak, while silver gained over 400% during the same period. Throughout both rallies, analysts repeatedly warned of imminent corrections, yet the fundamental drivers, quantitative easing, sovereign debt concerns, and currency debasement fears, kept both metals elevated far longer than technical indicators suggested possible.
The current environment shares key characteristics with both historical periods: fiscal profligacy, monetary policy uncertainty, geopolitical tensions, and a fundamental questioning of fiat currency stability. In such contexts, traditional technical analysis of both gold and silver provides less predictive value than fundamental macro analysis.
What Traders Should Watch Next
While short-term volatility and corrections remain normal even in strong bull markets, several factors will determine whether gold and silver can sustain their momentum through year-end and into 2026.
Key Indicators to Monitor:
- ETF Flows: Continued accumulation in physically-backed gold and silver ETFs signals sustained investment demand. The World Gold Council reports $67 billion in gold ETF inflows year-to-date through October 2025, while silver ETFs have seen significant accumulation despite some early-October profit-taking.
- COMEX Inventory Data: Silver stocks at COMEX warehouses hit an all-time high of 532 million ounces in October, while LBMA inventories declined, a dislocation that intensifies liquidity pressures.
- Fund Manager Allocations: The Bank of America Global Fund Manager Survey updates monthly. Watch for increases in precious metals allocations as institutional FOMO (fear of missing out) potentially drives the next wave of buying.
- Central Bank Purchases: Central banks continue accumulating gold at near-record pace, with 2025 on track to rival 2024’s historic buying levels according to World Gold Council data.
- Real Interest Rates: The Federal Reserve’s policy path remains crucial. Lower real rates reduce the opportunity cost of holding non-yielding assets like gold and silver, benefiting both metals.
- Gold-Silver Ratio: The ratio between gold and silver prices provides insight into relative value and risk appetite. A declining ratio suggests silver is outperforming, typically indicating increased industrial demand and investor risk appetite.
Bank of America raised its precious metals forecasts in October 2025, targeting $5,000 per ounce for gold and $65 per ounce for silver by 2026, with an average of $56.25 for silver. Goldman Sachs analysts noted that while silver faces “significantly more volatility and downside price risk” than gold in the near term, both metals benefit from the same macro drivers. Medium-term prospects remain positive as potential Fed rate cuts draw more private investors into precious metals.
The World Gold Council’s October 2025 scorecard highlights that despite elevated prices, several indicators suggest room for further gains. Real interest rates, while positive, are likely to decline. Credit spreads remain tight but can widen. Stock markets are at lofty valuations and vulnerable to correction. Each of these factors could drive additional safe-haven flows into precious metals.
Final Thoughts
Overbought doesn’t always mean overpriced, for gold or silver. When trust breaks down in paper money, when government shutdowns become routine, when deficits spiral beyond $2 trillion annually, when geopolitical tensions escalate between superpowers, both metals become the refuge, and technical charts can stay stretched for much longer than most expect.
The current gold and silver rally is fundamentally different from previous speculative bubbles because it’s rooted in structural concerns about fiscal sustainability, monetary policy credibility, and the erosion of dollar dominance. With 39% of institutional fund managers holding zero gold exposure and global gold ETF holdings still below 2020 peaks, the accumulation phase appears to be in its early stages rather than approaching exhaustion. This institutional underallocation affects both metals.
Silver’s supply-demand fundamentals add another layer of support beyond the macro factors driving gold. Industrial demand continues climbing while inventories decline, creating physical market tightness that forced a historic short squeeze in October 2025. The metal’s dual role as both industrial commodity and monetary asset positions it uniquely for the current environment, allowing it to benefit from both safe-haven flows and structural supply deficits.
History teaches that during periods of monetary stress and inflation, both gold and silver can remain technically overbought for extended periods. The 1979-1980 and 2008-2011 rallies saw both metals defy bearish technical signals for months or years as fundamental drivers overwhelmed momentum indicators. The synchronized nature of the current rally suggests similar macro forces are at work.
Short-term corrections and volatility remain inevitable for both metals. Heraeus analysts correctly note that “readings this high have typically been followed by corrections.” Traders should expect pullbacks, profit-taking, and periods of consolidation in both gold and silver. However, the macro backdrop, deficit spending, monetary policy uncertainty, geopolitical tensions, and weak fiat confidence, continues to favor structurally higher precious metals prices over the medium to long term.
For investors seeking to participate in gold and silver’s long-term potential while managing short-term volatility, physical ownership of both metals remains the most direct way to gain exposure. As we’ve seen throughout history, when paper currencies face credibility challenges, tangible assets, whether gold for wealth preservation or silver for both industrial and monetary exposure, provide the ultimate portfolio insurance.
Explore Bullion Trading LLC‘s comprehensive range of gold and silver bullion products for secure, allocated precious metals investing. Our extensive inventory of gold bars, silver coins, platinum, and palladium products provides the physical assets needed to implement sophisticated portfolio strategies in this era of monetary transition. Whether you’re seeking gold’s stability or silver’s dual industrial-monetary appeal, we offer the products to diversify and protect your wealth.