The precious metals market offers investors a unique analytical tool that exists nowhere else in finance: the gold-silver ratio. This deceptively simple metric has guided savvy investors for centuries, helping them optimize portfolios and capitalize on the cyclical relationship between gold and silver prices.
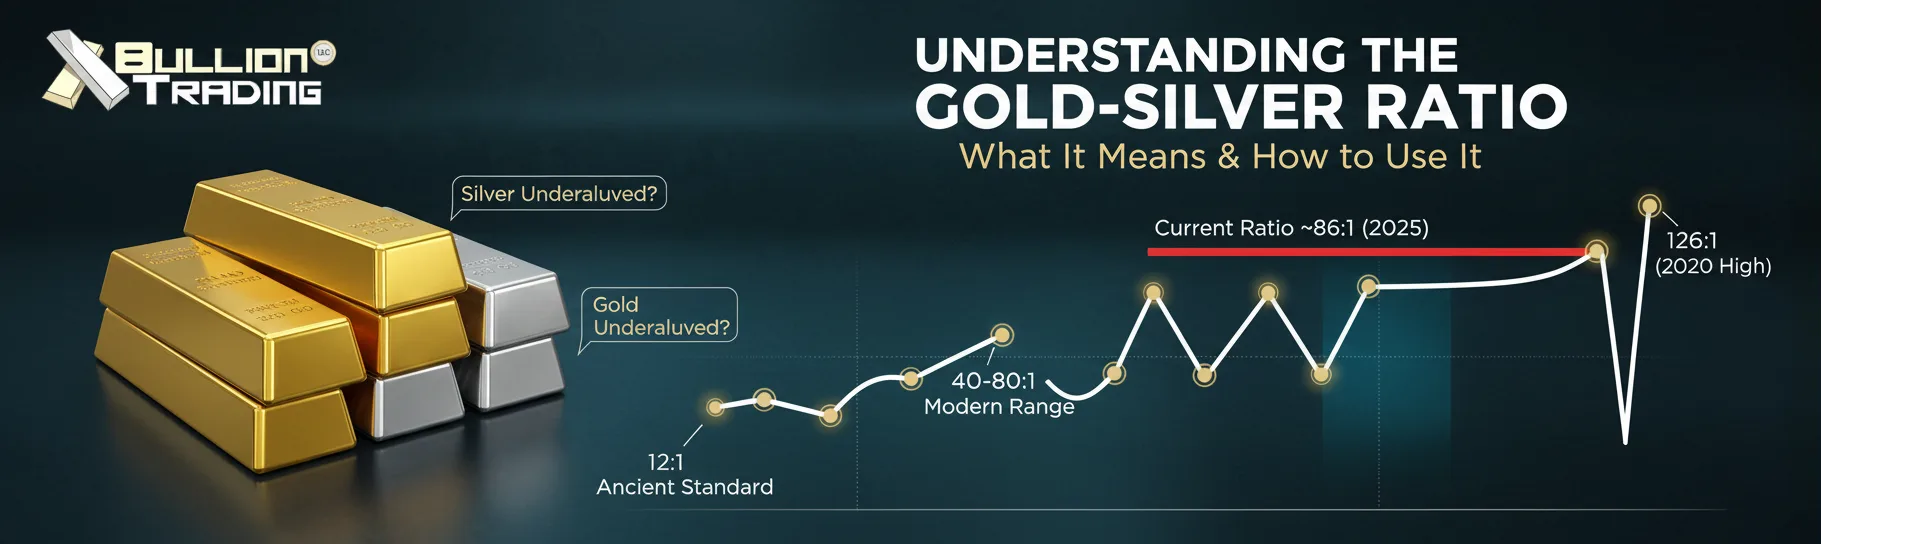
With the gold-silver ratio hovering around 86:1 in late 2025, meaning it takes approximately 86 ounces of silver to purchase one ounce of gold, understanding this indicator has never been more relevant. Whether you’re a seasoned precious metals investor or just beginning your bullion journey, mastering the gold-silver ratio can transform your investment strategy and potentially enhance your returns significantly.
This guide explores everything you need to know: what the ratio measures, how it’s changed throughout history, what it signals about market conditions, and most importantly, how you can use it to make smarter investment decisions in today’s volatile economic environment.
What Is the Gold-Silver Ratio?
The gold-silver ratio is elegantly simple: it represents how many ounces of silver are required to purchase one ounce of gold. You calculate it by dividing the current price of gold by the current price of silver.
Gold-Silver Ratio = Price of Gold per Ounce ÷ Price of Silver per Ounce
For example, if gold trades at $3,350 per ounce and silver trades at $37 per ounce, the gold-silver ratio would be approximately 90.5 (3,350 ÷ 37 = 90.5). This means you need 90.5 ounces of silver to equal the value of one ounce of gold.
When the ratio rises, gold is becoming more expensive relative to silver. When it falls, silver is gaining value compared to gold. Unlike stock price ratios or other financial metrics requiring complex analysis, the gold-silver ratio provides an instantly understandable snapshot of relative value between these two precious metals.
This metric matters because gold and silver, while both serving similar portfolio protection functions, behave differently in various economic conditions. The ratio helps investors identify when one metal may be undervalued relative to the other, creating potential trading opportunities that simply don’t exist in other asset classes.
This chart and additional resources are available in our Learning Center.
Historical Trends & Benchmarks
Understanding the gold-silver ratio’s historical context reveals how dramatically this relationship has evolved and why current levels carry particular significance.
Ancient Through Medieval Era: The Fixed Ratio Period
In ancient civilizations, the gold-silver ratio was often officially fixed by governments. The Roman Empire established the ratio at 12:1, meaning gold was valued at twelve times silver’s worth. This roughly reflected the natural occurrence ratio of these metals in the Earth’s crust and the relative difficulty of mining each metal.
The ratio remained relatively stable throughout recorded history, generally hovering between 12:1 and 15:1. When the United States passed the Coinage Act of 1792, the government officially set the gold-silver ratio at 15:1. These fixed ratios served as the backbone of bimetallic monetary systems, where currencies were backed by both gold and silver.
20th Century: The Floating Ratio Era
When governments detached their currencies from gold and silver standards in the 20th century, the ratio began to float freely based on market forces. From the 1980s through the 2010s, the gold-silver ratio typically ranged between 40:1 and 60:1, occasionally stretching to the upper 70s or low 80s during periods of economic stress.
This floating period revealed that the ratio responds dramatically to economic cycles, investor sentiment, and the unique supply-demand dynamics of each metal. Without government intervention maintaining artificial stability, the true nature of the gold-silver relationship emerged: highly responsive to economic conditions and far more volatile than historical fixed ratios.
Modern Extremes and Volatility
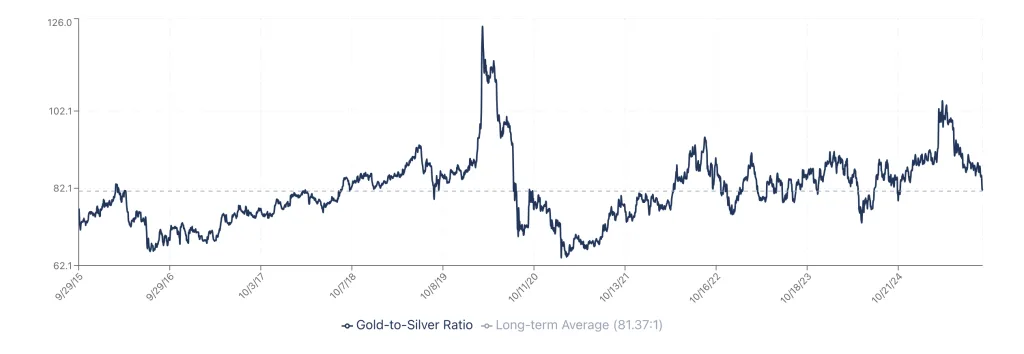
The 21st century has witnessed unprecedented volatility in the gold-silver ratio. The metric reached an all-time recorded high of 126:1 in March 2020 during the initial COVID-19 panic, when investors fled to gold while silver, with its substantial industrial demand, suffered from economic shutdown concerns.
Over the past 30 years, the gold-silver ratio has averaged approximately 68:1. However, this average masks tremendous volatility, with the ratio swinging from lows near 30:1 to highs above 120:1. These extreme movements create significant opportunities for investors who understand how to interpret and act on them.
Key Historical Benchmarks:
- Ancient/Medieval standard: 12-15:1
- Modern average (30 years): 68:1
- Typical range (1980s-2010s): 40-80:1
- All-time high: 126:1 (March 2020)
- Current level (late 2025): ~80-92:1
Gold-Silver Ratio Evolution
From Roman Empire to Modern Times – Click on any era to explore
What the Gold-Silver Ratio Can Signal
The gold-silver ratio serves as far more than an interesting historical curiosity, it's a practical tool providing multiple signals for precious metals investors.
Relative Value Indicator
The primary purpose of the gold-silver ratio is identifying when one metal may be undervalued relative to the other. When the ratio reaches historical extremes, it often signals that mean reversion may be approaching, the ratio returning toward its long-term average.
High ratio readings (above 80-90) historically suggest that silver is undervalued compared to gold, potentially presenting buying opportunities for silver. Low readings (below 50) may indicate gold is relatively undervalued compared to silver.
Market Sentiment Gauge
The ratio functions as a sophisticated sentiment indicator for precious metals markets and broader economic conditions. Rising ratios often correlate with increased economic uncertainty, as investors rush toward gold's traditional safe-haven status while silver, with its substantial industrial applications, suffers from concerns about economic slowdowns.
According to CME Group's 2025 analysis, "The gold-silver ratio has been tightly connected to the pace of Chinese growth." When China's economy accelerates, industrial silver demand strengthens, narrowing the ratio. When growth slows, silver suffers disproportionately, widening the ratio.
Falling ratios frequently coincide with economic recoveries and growing industrial demand, as silver benefits from increased manufacturing activity while gold's safe-haven premium diminishes.
How Investors Use the Ratio in Practice
Several proven strategies have emerged for leveraging the gold-silver ratio, each suited to different investor types and objectives.
Strategy 1: Mean Reversion Trading
The most common approach relies on mean reversion, the tendency of the ratio to return toward its long-term average after reaching extremes.
When the ratio is high (above 85-90): Consider accumulating silver relative to gold, as silver may be undervalued. Investors holding gold might exchange some holdings for silver, expecting the ratio to eventually narrow.
When the ratio is low (below 50-55): Consider accumulating gold relative to silver, as gold may be undervalued. Investors holding silver might exchange some holdings for gold, expecting the ratio to eventually widen.
Historical example: An investor owning one ounce of gold when the ratio reached 100:1 could exchange it for 100 ounces of silver. If the ratio subsequently fell to 50:1, those 100 ounces of silver could be exchanged for two ounces of gold, doubling their gold holdings without adding new capital.
Vaulted's historical analysis examined a portfolio from 2000 to 2024, comparing a static allocation (90% gold, 10% silver) versus ratio trading. The results showed the ratio trading approach generated 1,212% total returns versus 541% for the static portfolio, more than doubling the outcome through systematic rebalancing at ratio extremes.
Strategy 2: Dollar-Cost Averaging with Ratio Awareness
For investors building positions over time, ratio awareness enhances dollar-cost averaging without requiring active trading.
Maintain target allocation percentages (perhaps 70% gold, 30% silver), but adjust what you buy based on the ratio:
- When the ratio moves above 80, tilt new purchases toward silver
- When the ratio falls below 60, tilt new purchases toward gold
- Continue buying regularly regardless of ratio position
This captures ratio benefits without requiring large portfolio exchanges or perfect timing.
Strategy 3: Threshold-Based Rebalancing
Investors with established portfolios can set predetermined ratio levels triggering rebalancing actions:
- Normal range (60-80:1): Maintain current allocations
- High ratio (above 90:1): Exchange 10-20% of gold holdings for silver
- Very high ratio (above 100:1): Exchange 20-30% of gold holdings for silver
- Low ratio (below 55:1): Exchange 10-20% of silver holdings for gold
- Very low ratio (below 45:1): Exchange 20-30% of silver holdings for gold
Specific thresholds and percentages should reflect your risk tolerance, investment timeline, and conviction in mean reversion.
Strategy 4: Strategic Allocation for New Investors
If you're beginning to build precious metals exposure, use the ratio to guide initial allocation without requiring you to own both metals already.
Current ratio above 85 (silver relatively cheap): Start with higher silver allocation, perhaps 40-50% of precious metals portfolio.
Current ratio 60-85 (near average): Build balanced positions, perhaps 60-70% gold and 30-40% silver.
Current ratio below 60 (gold relatively cheap): Emphasize gold initially, perhaps 75-85% gold allocation.
Important Cautions
All ratio strategies require patience. Market cycles can last years or even decades. As Vaulted notes, "Ratio trading also requires a very long-term investment horizon." Investors must be prepared to wait years for positions to work out.
Transaction costs matter significantly. Physical bullion carries round-trip costs of 5-15%, so ratio movements must be substantial to justify trading. Frequent adjustments may generate more costs than value.
Gold-Silver Ratio Investment Decision Tree
Silver Relatively Cheap
Balanced Conditions
Gold Relatively Cheap
Limitations & Risk Factors
While powerful, the gold-silver ratio has important limitations that investors must understand.
The Ratio Can Remain Extreme Indefinitely
One of the biggest dangers is assuming extreme ratios must quickly revert to average. The ratio exceeded 80:1 in 2018 and has remained elevated for much of the past seven years. An investor who aggressively traded into silver in 2018 expecting mean reversion would have endured years of underperformance.
Markets can remain irrational longer than investors can remain solvent. Never use borrowed money or leverage for ratio trades, regardless of how compelling the opportunity appears.
Structural Changes May Create "New Normal"
The ratio's 30-year average of 68:1 might not reflect future norms if fundamental conditions have changed. Central bank buying, the decline of photography's silver demand, and other structural factors might establish a permanently higher average ratio.
If the ratio's sustainable range has shifted from 50-80 to 70-100, strategies based on historical averages will consistently misidentify value, buying silver too early and selling gold prematurely.
What the Ratio Doesn't Tell You
The gold-silver ratio indicates relative value, not absolute price direction. A declining ratio might result from gold falling faster than silver, silver rising faster than gold, or any combination. The ratio doesn't guarantee either metal will rise in absolute terms.
The ratio also doesn't predict timing. Even when correctly identifying extreme levels, the actual reversal might take months or years to materialize.
Transaction Costs and Tax Implications
Every ratio trade incurs costs that can erode returns:
Physical bullion costs: Dealer premiums on purchases, discounts when selling, shipping, insurance, and storage create substantial round-trip costs of 5-15%.
Tax consequences: In the US, precious metals are taxed as collectibles with long-term capital gains rates up to 28%. Each ratio trade creates a taxable event, potentially pushing investors into higher brackets.
For trades to be profitable after costs and taxes, ratio movements must be large enough to overcome these frictions. Small, frequent adjustments typically lose money.
Correlation Breakdown Risk
The entire premise of ratio trading relies on gold and silver maintaining a price relationship that eventually reasserts itself. The 2025 phenomenon of weakening correlation between gold and silver, currently at their weakest correlation in over two decades, raises questions about this assumption.
If the metals increasingly respond to entirely different fundamental factors, the historical ratio relationships may lose predictive power. Investors must monitor whether the ratio continues exhibiting mean reversion characteristics.
Over-Emphasis Risk
For most investors, precious metals represent 5-20% of total portfolio. Spending enormous energy optimizing this allocation through ratio trading might yield less benefit than improving your broader investment strategy, increasing savings rate, or reducing fees elsewhere.
What Current Levels Suggest
The ratio around 86:1 sits in historically elevated territory. Since 2000, whenever the ratio exceeded 80:1, it eventually reverted toward lower levels, though sometimes taking years to do so.
This positioning could indicate:
- Silver is undervalued relative to gold based on historical norms
- Structural changes have shifted the ratio's sustainable range higher
- Near-term uncertainty favors gold over silver regardless of long-term value
Investors should consider the current ratio as one data point among many, not a definitive signal requiring immediate action.
Conclusion & Actionable Takeaways
The gold-silver ratio isn't magic, it won't eliminate risk, guarantee profits, or replace sound financial planning. But for investors willing to study its history, understand its drivers, and apply its insights patiently and systematically, the ratio offers a unique tool for optimizing precious metals portfolios.
As you navigate 2025's complex economic environment, characterized by persistent inflation concerns, geopolitical tensions, and unprecedented monetary policy, the gold-silver ratio reminds us that precious metals markets contain internal dynamics worth understanding. Whether you're building your first position or optimizing existing holdings, this centuries-old metric continues offering valuable guidance.
At Bullion Trading LLC, we help investors navigate the precious metals market with comprehensive selections of gold bullion, silver products, platinum, and palladium. Whether you're implementing a ratio-based strategy or building your initial precious metals position, our expertise and competitive pricing support your investment success.
Remember: the gold-silver ratio is one tool among many for building wealth. Use it wisely, remain patient, and let the timeless relationship between these monetary metals work to your advantage over the decades ahead.