
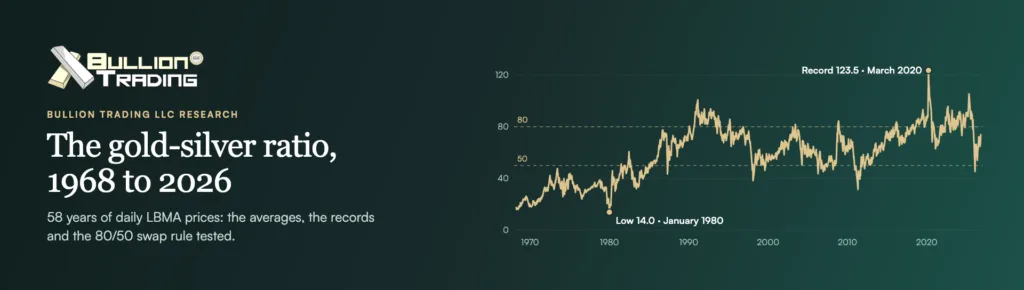
For today’s number, see our live ratio and full chart: the ratio through the trading day, every daily close since 1968, yearly figures since 1687 and a swap calculator at our prices.
The prices behind those numbers are the LBMA Gold Price and LBMA Silver Price, the London benchmarks set in daily auctions. It matters now because silver’s run to a record in January 2026 pulled the ratio down to 45.4, its lowest close since 2011, and it has since climbed back to the middle of its range, so the answer to “is silver cheap?” depends on which history you compare it with.
| Key finding | Result |
|---|---|
| First close above 90 (free market) | 12 October 1990, at 91.4; first above 100 on 25 February 1991 |
| First year that averaged above 90 (since 1687) | 1940, at 99.8, when gold was fixed at $35 |
| Record high | 123.5 on 17 March 2020, one of four closes above 120 that month |
| Record low | 14.0 on 2 January 1980 |
| Average since 1968 | 59.1 (median 61.6); 68.8 since 2000; 81.1 over the last five years |
| Share of trading days above 80, above 90, below 50 | 15%, 3.5% and 32% since 1968 |
| 18 November 2026 | 82.7, higher than on 88% of days since 1968 |
| “Silver above 80, gold below 50” swap rule, 1968 to 2026 | 1 oz of gold became 7.11 oz before costs and 2.49 oz after today’s dealer premiums; a version without hindsight: 2.51 oz and 0.85 oz |
What is the gold-silver ratio?
The gold-silver ratio is the price of an ounce of gold divided by the price of an ounce of silver: on 18 November 2026, $3,723.87 ÷ $45.05 = 82.7, so one ounce of gold was worth 82.7 ounces of silver. The ratio has no units, so it reads the same in dollars, pounds or euros.
When the ratio rises, gold is gaining on silver; when it falls, silver is gaining on gold. A high reading means silver is cheap relative to gold, and a low one means gold is cheap relative to silver. It says nothing about whether either metal is cheap in dollars: both can fall while the ratio moves in your favor.
A note on the search term: in mathematics, the “silver ratio” is 1 + √2, about 2.414, a cousin of the golden ratio. It has nothing to do with metal prices.
When did the gold-silver ratio first exceed 90?
In the free market for both metals, the ratio first closed above 90 on 12 October 1990, at 91.4, when the LBMA prices were $388.25 for gold and $4.248 for silver. It crossed 100 for the first time on 25 February 1991 (gold $357.65, silver $3.548) and then stayed above 80 for 702 trading days in a row, from 14 September 1990 to 2 July 1993, the longest such run in the data.
It had been there once before, under fixed gold prices. In MeasuringWorth’s annual series since 1687, the ratio averaged 99.8 in 1940 and stayed above 90 from 1940 to 1942. Gold was fixed at $35 an ounce then, and a ratio near 100 implies silver around 35 cents. So the precise answer to “when did the gold-silver ratio first exceed 90?” is 1940 on annual averages, and 12 October 1990 on daily prices in the floating era.
Who fixed the ratio at 15 to 1?
For most of recorded history the ratio was set by law or custom rather than markets. Under Augustus, Roman coin weights imply about 12 ounces of silver per ounce of gold (Pliny gave 12½), according to Smith’s Dictionary of Greek and Roman Antiquities. In the United States, Treasury Secretary Alexander Hamilton recommended 15 to 1 in his Report on the Establishment of a Mint of 28 January 1791, close to the market rate of about 15.05 at the time, and Section 11 of the Coinage Act of 1792 wrote “fifteen to one” into law. Congress moved it to about 16 to 1 in 1834.
From 1687 to 1872 the annual ratio never left the range of 14.1 to 16.3. Once the leading economies moved to gold standards in the 1870s, silver lost its monetary role and the ratio climbed past 30 by the 1890s. The milestones since then:
| When | Ratio and what happened |
|---|---|
| 1940 | 99.8 annual average, the highest year in the series since 1687 |
| 1 April 1968 | 16.7, the first day of the LBMA dollar series |
| 2 January 1980 | 14.0, the all-time low in daily data, during the Hunt brothers’ silver squeeze |
| 12 October 1990 | 91.4, the first close above 90 |
| 25 February 1991 | 100.8, the first close above 100 |
| 21 November 2008 | 84.5, the financial-crisis peak |
| 28 April 2011 | 31.5, when silver hit $48.70 |
| 17 March 2020 | 123.5, the record |
| 22 April 2025 | 105.3 (gold $3,433.55, silver $32.61) |
| 27 January 2026 | 45.4, the lowest close since September 2011 |
| 18 November 2026 | 82.7 |
What happened to the ratio in March 2020?
It set its record: 123.5 on 17 March 2020, with gold at $1,536.20 and silver at $12.44 on LBMA prices, and it closed above 120 on four days (17, 18, 19 and 23 March). The jump was abrupt. The ratio was 99.1 on Friday 13 March and 114.7 the following Monday, as the pandemic sell-off hit silver much harder than gold. A week earlier, on 9 March, BullionVault had reported that the ratio spiked above 100, matching the February 1991 record.
Figures of 124 to 126 also circulate for March 2020; they come from other price feeds, such as intraday spot quotes, rather than the once-a-day benchmark, which is why sources disagree. The extreme did not last: the ratio was back below 100 on 18 May 2020 and below 80 on 27 July 2020.
What is the historical average gold-silver ratio?
It is 59.1 across every trading day since April 1968 (median 61.6), but the answer depends heavily on the window: 68.8 since 2000, 67.8 over the last 30 years and 81.1 over the last five years. The typical range moves too. Half of all days since 1968 fell between 43.0 and 74.3; since 2000, between 58.8 and 78.3; over the last five years, between 77.9 and 87.5.
| Period | Average | Median | Low | High | Days above 80 | Days below 50 |
|---|---|---|---|---|---|---|
| 1968–69 | 20.9 | 20.9 | 16.1 (Apr 1968) | 26.4 (Jul 1969) | 0.0% | 100.0% |
| 1970s | 31.7 | 32.4 | 18.1 (Mar 1970) | 47.6 (Jun 1973) | 0.0% | 100.0% |
| 1980s | 52.7 | 50.7 | 14.0 (Jan 1980) | 77.6 (Oct 1986) | 0.0% | 48.6% |
| 1990s | 73.7 | 74.3 | 38.3 (Feb 1998) | 100.8 (Feb 1991) | 32.4% | 5.4% |
| 2000s | 61.6 | 60.6 | 43.7 (Apr 2006) | 84.5 (Nov 2008) | 1.0% | 7.2% |
| 2010s | 67.6 | 69.0 | 31.5 (Apr 2011) | 93.3 (Jul 2019) | 16.5% | 8.5% |
| 2020s (to 18 Nov 2026) | 81.0 | 81.8 | 45.4 (Jan 2026) | 123.5 (Mar 2020) | 55.4% | 0.4% |
| Full period, 1968–2026 | 59.1 | 61.6 | 14.0 (Jan 1980) | 123.5 (Mar 2020) | 15.0% | 32.0% |
| Since 2000 | 68.8 | 67.9 | 31.5 (Apr 2011) | 123.5 (Mar 2020) | 20.7% | 5.9% |
| Last five years | 81.1 | 83.4 | 45.4 (Jan 2026) | 105.3 (Apr 2025) | 64.0% | 0.6% |
Readings above 90 are rare: 3.5% of days since 1968 and 4.1% since 2000. Readings below 50 were normal in the 1970s and 1980s but have become rare too, at 5.9% of days since 2000 and seven days in the last five years, all between 20 and 30 January 2026.
What moves the gold-silver ratio?
Mostly silver. It is the smaller, more industrial and more volatile metal, so the ratio tends to rise when economies slump and markets panic, and to fall when silver leads a rally. CME Group economist Erik Norland lists four drivers: supply growth, central-bank buying, technology (photography’s decline and solar’s rise in silver demand) and the pace of Chinese growth.
- Central banks buy gold, not silver. They have been net buyers since 2008, Norland notes, and bought 863 tonnes in 2025, well above their 2010 to 2021 average of 473 tonnes, according to the World Gold Council.
- Silver is mostly an industrial metal. The Silver Institute forecast in February 2026 industrial fabrication of about 650 million ounces this year and a sixth straight market deficit, of 67 million ounces. Slowdowns hit that demand; booms lift it.
- Squeezes push the ratio down fast. 1980, April 2011 and January 2026 all produced sharp silver spikes and ratio lows, and each one reversed within weeks.
The two metals usually move together, but not always tightly. By Bullion Trading LLC’s measure, the correlation of their daily price changes fell to 0.41 in 2025, the lowest since 2015 (0.38), then jumped to 0.75 so far in 2026, the highest of any year since 1995. A separate guide explains why silver is so cheap compared with gold, starting from the supply side.
Does the “buy silver above 80, gold below 50” rule work?
In hindsight, spectacularly; in practice, far less. Bullion Trading LLC tested the rule on every daily close since April 1968: start with 1 oz of gold, swap it all for silver when the ratio closes above 80, swap back to gold when it closes below 50. The logic is the mean-reversion example in every guide: 1 oz of gold swapped at 100 buys 100 oz of silver, and if the ratio falls to 50, those 100 oz buy 2 oz of gold.
| Rule | Swaps | Before costs | 5% per swap | Today's premiums |
|---|---|---|---|---|
| Silver above 80, gold below 50 | 9 | 7.11 oz | 4.59 oz | 2.49 oz |
| Silver above 70, gold below 60 | 15 | 3.06 oz | 1.47 oz | 0.56 oz |
| No hindsight: trailing 10-year 90th / 10th percentile | 10 | 2.51 oz | 1.54 oz | 0.85 oz |
| Hold the gold | 0 | 1.00 oz | 1.00 oz | 1.00 oz |
The 80/50 rule made eight swaps, the first on 30 January 1990 and the last on 20 January 2026, and multiplied the starting ounce sevenfold before costs. At today’s dealer premiums it still ended with 2.49 oz. The catch is that 80 and 50 are numbers chosen by looking back at 58 years of data. An investor in 1990, whose history showed an average near 40, had no reason to pick them.
So the test includes a version without hindsight: swap to silver when the ratio rises above the top 10% of its previous ten years, and back when it falls into the bottom 10%. That rule made ten swaps and ended with 2.51 oz before costs and 0.85 oz at today's premiums, worse than holding the gold.
The narrower "buy silver above 70, gold below 60" band that some traders use made 15 swaps and looked fine before costs, at 3.06 oz. With today's premiums it ended with 0.56 oz, a loss against simply holding gold, because every swap pays a premium on the metal bought (and, in real life, usually a discount on the metal sold). Since 2000, all six moves above 80 eventually fell back below 70, but one of them lasted from 30 September 2021 to 10 December 2025.
2016 to 2026: the swap that worked, after ten years
The rule’s last round trip shows what “worked” felt like. On 28 January 2016 the ratio closed at 82.0, with gold at $1,114 and silver at $13.58, so 1 oz of gold bought 82.0 oz of silver.
Then the ratio kept rising. On 17 March 2020 those 82 oz were worth 0.66 oz of gold, a 34% shortfall in gold terms, and the ratio averaged 88 as recently as 2025. The exit came only in January 2026, when silver’s surge took the ratio below 50 on seven trading days, all between 20 and 30 January. On 20 January it closed at 49.6 (gold $4,747.80, silver $95.70), and 82.0 oz of silver bought 1.65 oz of gold.
That is a 65% gain in ounces, before costs, for ten years of patience. With 5% lost on each swap it was 1.50 oz; at today’s premiums, 1.33 oz; and both sales were taxable. An investor who missed that window and still held the silver on 18 November 2026 had the equivalent of 0.99 oz of gold. Silver itself hit a record $118.45 on 29 January and was back at $78.71 by 5 February, as the account of the January 2026 price crash describes.
What does a gold-silver ratio swap really cost?
More than the ratio’s daily moves suggest, because you pay a premium every time you buy and usually take less than spot every time you sell. Bullion Trading LLC check/wire prices on 18 November 2026 put the median premium at 19.91% over the Ask for nine in-stock 100 oz silver bars (range 17.71% to 22.15%) and 3.62% for 20 in-stock 1 oz gold bars. These are our prices, one dealer’s snapshot; premiums vary by product and over time.
Taxes come on top. Outside a tax-deferred account, each sale is taxable, and long-term gains on bullion are taxed as collectibles at a maximum 28% rate; the tax code’s definition of a collectible includes “any metal or gem”. Swapping one metal for another is not a like-kind exchange either: since 1 January 2018 that treatment applies only to real property. The details are in the guide to the collectibles tax on gold.
Silver is also bulky. At a ratio of 82.7, one ounce of gold’s worth of silver weighs about 2.57 kilograms (82.7 × 31.1035 g), which matters for shipping, storage and insurance.
Many investors use the ratio without full swaps at all:
| Approach | How it works | Costs | Main risk |
|---|---|---|---|
| Tilt new purchases | Keep buying on a schedule, but put more of each purchase into silver when the ratio is high and into gold when it is low | Only the premiums you would pay anyway | The tilt can run the wrong way for years |
| Rebalance a target mix | Hold a fixed split by value and rebalance once a year, or when one metal drifts well past its share | Occasional sales and purchases | Selling the metal that keeps rising |
| Swap a slice | Exchange part of a holding (say 10% to 20%) at an extreme, rather than all of it | Two sets of premiums on the slice, plus tax | Small gains after costs |
| Full swap | Exchange the whole holding at a threshold and swap back at another | Two sets of premiums on everything, plus tax | Long waits and deep drawdowns, as in 2016 to 2026 |
Tilting regular purchases is the simplest, and it combines naturally with dollar-cost averaging. For the bigger question of how much of each metal to hold, see how much gold and silver to own. For most people metals are one slice of a portfolio, and the ratio is a detail within that slice.
Where does the gold-silver ratio stand now?
At 82.7 on 18 November 2026: well above its 30-year average of 67.8, well above the long-run median of 61.6, and close to the 81.1 average of the last five years. Since the 27 January low of 45.4 it has risen by more than half, and it has averaged 64.7 so far this year.Both directions are plausible from here. The ratio could climb again if industrial demand weakens or markets turn to gold as a haven, as in 2008, 2020 and April 2025. It could fall if silver demand reasserts itself, as in late 2025 and January 2026, when the ratio dropped from above 80 to the 40s. A structural reading is possible too: if central-bank gold buying and the loss of silver’s monetary role have raised the ratio’s normal range for good, then 83 is simply average, not cheap silver.
How we did the research
Ratios are the LBMA Gold Price PM divided by the LBMA Silver Price, both in U.S. dollars, for every day both were published from 1 April 1968, the first day of the dollar gold series, to 28 September 2026: 14,672 days. For 29 September to 18 November 2026 we used Bullion Trading's own weekday spot closes (Swissquote mid-prices near 5 pm New York), because the LBMA archive we hold ends there; they cover 37 days; they are spot quotes, not benchmark prices, and can differ from the LBMA price by a few dollars on a given day. Long-run annual figures before 1968 come from MeasuringWorth, which uses Hamburg prices to 1832, London to 1914 and New York since.
Averages and medians are of daily closes; “days above 80” counts closes strictly above 80. The swap test trades at the close on the day the threshold is crossed, with no delay, and values a silver holding in gold at that day’s ratio. “Today’s premiums” are the medians, over the Ask, of our in-stock 100 oz silver bars and 1 oz gold bars on 16 October 2026, applied to every historical swap; actual premiums in earlier decades were different, which is why the table also shows a flat 5% per swap. Selling is assumed at spot, which flatters every swap. Taxes, shipping and storage are left out. The trailing rule uses only the 2,520 trading days (about ten years) before each date. Correlations are of daily log changes in each calendar year. The year-by-year averages, lows, highs and year-end ratios for 1968 to 2026 are available as a CSV download.
| Date | Ratio at close | Swap | Holding after |
|---|---|---|---|
| 30 Jan 1990 | 80.4 | Gold to silver | 80.41 oz silver |
| 10 Dec 1997 | 49.1 | Silver to gold | 1.639 oz gold |
| 2 Jun 2003 | 81.1 | Gold to silver | 132.84 oz silver |
| 31 Mar 2006 | 49.5 | Silver to gold | 2.683 oz gold |
| 16 Oct 2008 | 80.3 | Gold to silver | 215.53 oz silver |
| 9 Nov 2010 | 49.8 | Silver to gold | 4.33 oz gold |
| 28 Jan 2016 | 82.0 | Gold to silver | 355.23 oz silver |
| 20 Jan 2026 | 49.6 | Silver to gold | 7.16 oz gold |
| 16 Nov 2026 | 82.1 | Gold to silver | 588.01 oz silver |
Limits: the LBMA archive has a few days where one metal’s price looks out of line with the days around it (in September 1979, for example); we kept the published values. One benchmark a day misses intraday extremes. And 58 years hold only a handful of full ratio cycles, too few to prove that any threshold rule will keep working.
What the gold-silver ratio can and can’t tell you
The ratio is a good thermometer for relative value: at 82.7 it says silver is cheap against gold by the standards of the last 30 years. It is a poor timer. Extremes have lasted for years, the long-run average has drifted from the 30s to the 80s, and the swap rules that look best in hindsight lose most of their edge once you pick thresholds without knowing the future and pay real premiums. Used to tilt regular purchases, it costs little; traded in full, it demands long patience, a tolerance for drawdowns and a large move just to break even.
Frequently asked questions
Who suggested fixing the ratio of silver to gold at 15 to 1?
Alexander Hamilton, in his January 1791 Report on the Establishment of a Mint. Congress adopted 15 to 1 in the Coinage Act of 1792 and changed it to about 16 to 1 in 1834.
What gold-silver ratio is considered high?
Above 80 has been high by long-run standards: only 15% of trading days since 1968 closed there, though 64% of the last five years did. Above 90 is rare in any period, at 3.5% of days since 1968.
Is the “silver ratio” the same as the gold-silver ratio?
In investing, people often say “silver ratio” for the gold-silver ratio. In mathematics, the silver ratio is a different thing: the number 1 + √2, about 2.414.
What was the gold-silver ratio in March 2020?
It closed at a record 123.5 on 17 March 2020 on LBMA prices and stayed above 120 on four days that month. It was back below 100 by 18 May 2020.
Sources
- LBMA, LBMA Gold Price and LBMA Silver Price: daily benchmark prices from 1968, the basis of every ratio, average and swap test computed here.
- MeasuringWorth, The Price of Gold, 1257 to Present: annual gold/silver price ratio since 1687 (1940 peak, pre-1968 history).
- World Gold Council, Coinage Act of April 2, 1792 (Section 11, fifteen to one) and Gold Demand Trends full year 2025 (central-bank purchases).
- National Archives, Founders Online, Hamilton’s Report on the Establishment of a Mint (1791 recommendation).
- Library of Economics and Liberty, U.S. coinage laws (1834 change).
- Smith’s Dictionary of Greek and Roman Antiquities, “Aurum” on LacusCurtius (Roman gold-silver ratio).
- BullionVault, report of 9 March 2020 (ratio above 100, matching February 1991).
- CME Group, Erik Norland, Four major drivers of the gold-silver price ratio (2025).
- The Silver Institute, 2026 market outlook, 10 February 2026 (industrial fabrication, deficit).
- IRS, Topic 409, Capital gains and losses (28% collectibles rate) and like-kind exchanges limited to real property; Cornell LII, 26 U.S. Code § 408(m) (collectibles include metals).
- Wolfram MathWorld, Silver Ratio (the mathematical constant).
- Bullion Trading LLC check/wire prices on 18 November 2026 (premiums on in-stock 100 oz silver bars and 1 oz gold bars) and weekday spot closes after 28 September 2026.