
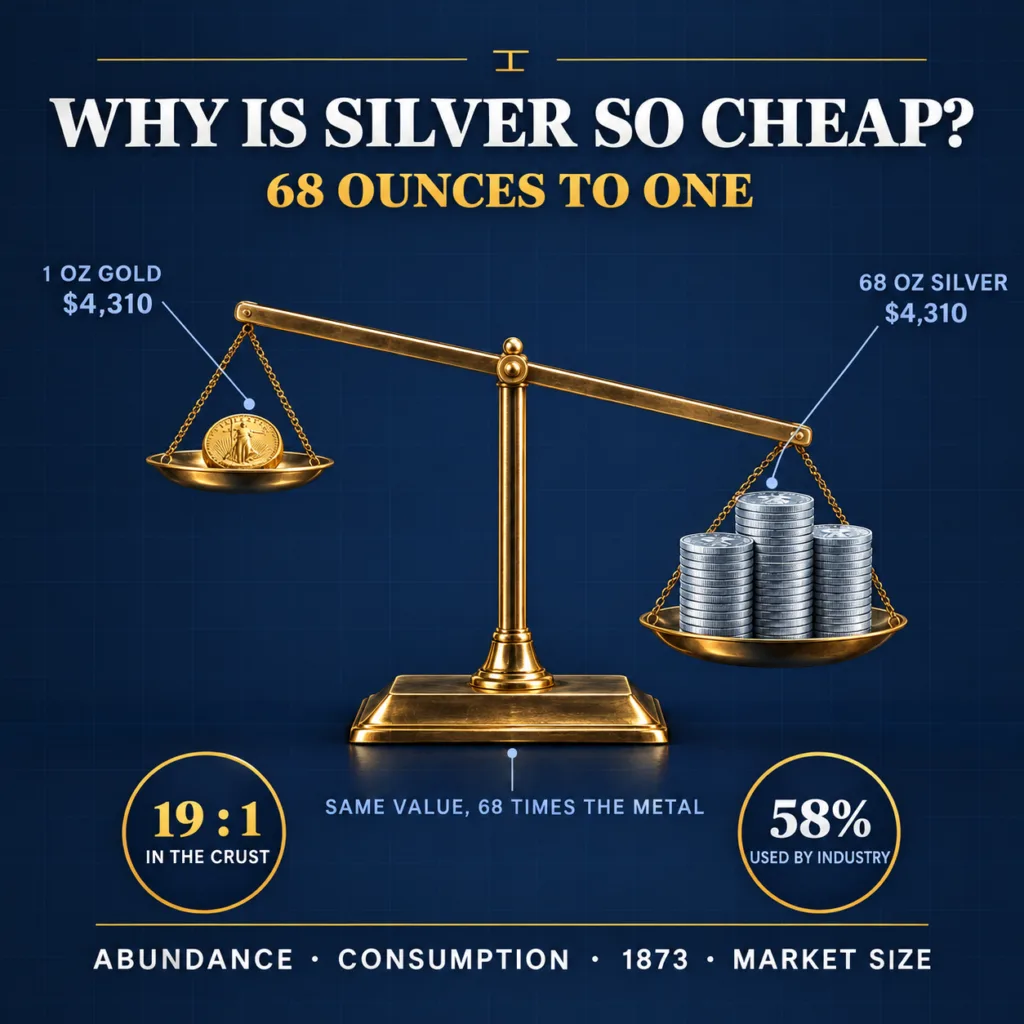
On September 15, 2026, an ounce of gold cost about $4,310 and an ounce of silver about $63.50. That is 68 ounces of silver for one of gold. The question people type into Google, why is silver so cheap, has a short answer and a long one. The short answer is that there is more of it, we use it up, and no central bank wants it. The long answer is more interesting, because geology alone would put the ratio near 19 to 1, not 68 to 1. Something other than scarcity is doing most of the work, and once you see what it is, the low price stops looking like a mistake.
Geology explains the first 19 ounces
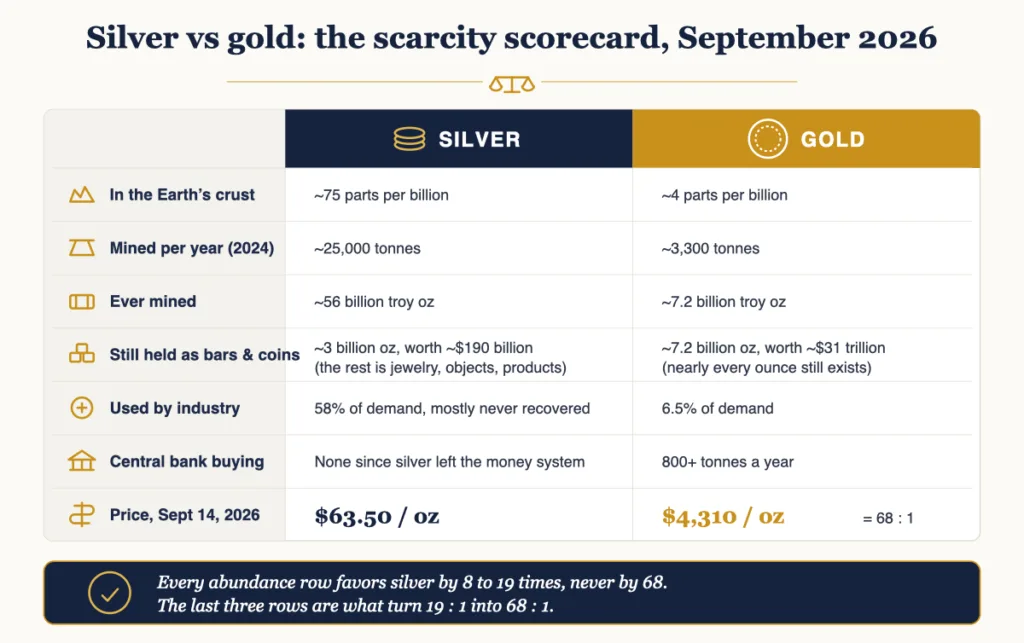
Start with the rock. The U.S. Geological Survey puts the average concentration of gold in the Earth’s crust at 0.004 parts per million, or four grams in every thousand tonnes of crust. Silver runs at about 0.075 parts per million. Silver is therefore around 19 times more common than gold in the ground, a figure the USGS silver profile states outright. If price tracked nothing but how hard an element is to find, the ratio would sit near 19.
Mining tells a similar story. In its latest commodity summaries, the USGS estimates world mine production in 2024 at about 25,000 tonnes of silver against around 3,300 tonnes of gold, about 7.6 ounces of new silver for every ounce of new gold. Across all of history the proportion is nearly identical. Humanity has dug up about 1.74 million tonnes of silver, according to figures compiled by CPM Group, and about 222,600 tonnes of gold as of mid-2026, according to the World Gold Council. That is some 56 billion ounces of silver against a little over 7 billion ounces of gold. Nearly eight to one.
So every measure of physical abundance lands somewhere between 8 and 19, and none gets close to 68. Scarcity is a real part of the answer, but it is the smaller part.
Gold is hoarded. Silver is consumed.
Of the 1.74 million tonnes of silver ever mined, CPM Group estimates that 7 to 10 percent has simply been lost, and of the 1.6 million or so tonnes that remain, about 800,000 tonnes sits in jewelry, tableware and religious objects and another 800,000 tonnes is embedded in industrial products, most of it in quantities too small to ever recover. Only around 100,000 tonnes exists as bullion and coin, and identifiable inventories in vaults and exchanges run closer to 90,000 tonnes. Call it 3 billion ounces of silver in a form you could buy, out of 56 billion dug up.
Gold is the mirror image. Because it is so valuable per gram, almost nothing is ever thrown away, and the World Gold Council states plainly that since gold is virtually indestructible, almost all of it is still around in one form or another, most of it as jewelry and bars.
Now price both piles. Seven billion ounces of gold at $4,310 is about $31 trillion. The investable silver stock, generously counted, is about $190 billion. Even if you dragged every surviving teapot, fork and circuit board onto the scale, silver in all forms would be worth a little over $3 trillion, a tenth of gold. Silver is a rounding error next to the gold market, and that size difference is behind almost everything strange about how silver trades, from its violent price swings to the way one big buyer, as the Hunt brothers showed, can bend the whole thing.
The consumption side is still running. The Silver Institute’s World Silver Survey 2026, compiled by Metals Focus, puts 2025 industrial demand at 657.4 million ounces out of 1.13 billion ounces of total demand, about 58 percent. A solar panel or a phone holds too little to be worth stripping, so that metal is gone for good. Gold’s equivalent figure is tiny. The World Gold Council’s full-year 2025 report shows technology taking 322.8 tonnes out of just under 5,000 tonnes of total demand, about 6.5 percent. Another 43 percent of gold demand in 2025 was investment, and central banks took most of the rest. Gold is bought to be kept. Silver is bought to be used.
The 1873 law that took silver out of the money supply
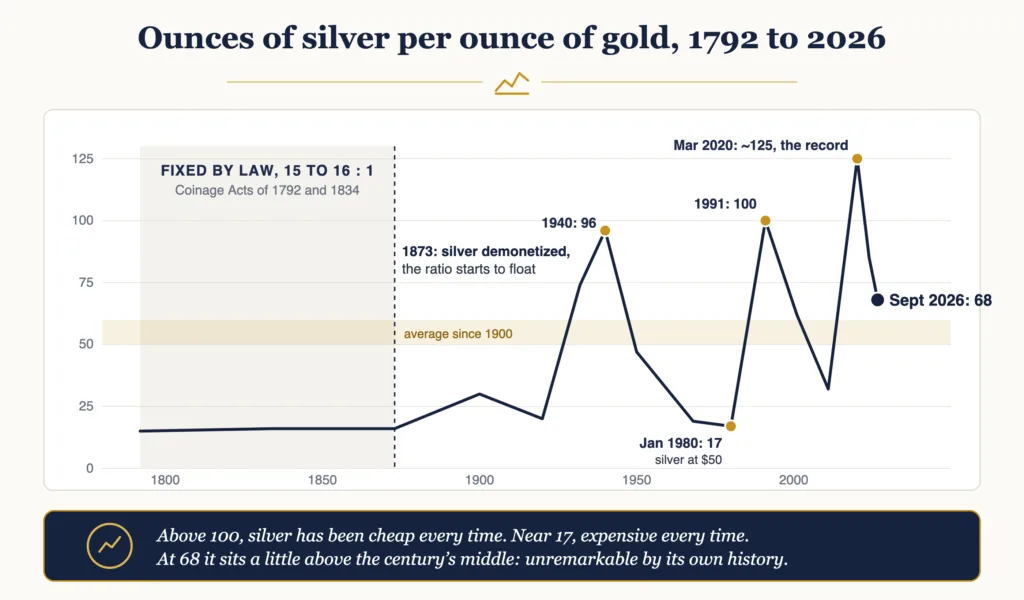
For most of recorded history, the gold-silver ratio was not a market price at all. It was set by governments. The U.S. Coinage Act of 1792 fixed it at 15 to 1, and an adjustment in 1834 moved it to 16 to 1. That is why old silver dollars and gold coins carry the face values they do. Then came the Coinage Act of 1873, which quietly dropped the standard silver dollar from the list of coins the Mint would strike. (It kept a heavier trade dollar, but that one was meant for export to Asia, and Section 15 of the Act limits its legal tender status to five dollars.) Silver stopped being money in the United States, and within a few years most of Europe had made the same move.
Farmers whose debts got heavier under the resulting deflation called it the Crime of 1873, and free silver dominated American politics for a quarter century, as the Library of Congress’s guide to the currency question records.
The economic consequence is easy to miss. The moment silver lost its monetary role, it lost the one buyer that never sells: the state. Central banks today hold around 39,000 tonnes of gold and have been adding more than 800 tonnes a year for several years running. They hold essentially no silver. The last serious government hoard, the U.S. strategic stockpile, was so depleted by 2002 that Congress had to pass a law letting the Mint buy silver on the open market to keep striking Silver Eagles, and the coins that went with it were stripped of silver in 1965, a story told in detail in the piece on why the U.S. stopped making silver coins. Remove the sovereign bid from any market and the price falls to what private buyers and industry will pay. That is what happened to silver, and it has never come back.
Why the ratio swings so hard
Once the ratio floated, it never settled. Using the annual average prices in the U.S. Geological Survey’s historical statistics, it sat near 30 in 1900, hit 74 in the depths of 1932, reached 96 in 1940, and was back down to 19 by 1968.
On a daily basis the swings were wilder still. The ratio collapsed to about 17 in January 1980 when silver hit $50 while the Hunt brothers were cornering the market. It was back above 100 in 1991, down near 32 in 2011, and hit its modern record of roughly 125 in March 2020, when silver briefly traded under $12. Average the whole period since 1900 and you land somewhere between 50 and 60. Today’s 68 is above that average, but not dramatically so. For the mechanics of reading the ratio, and how traders use it to swap between metals, the guide to understanding the gold-silver ratio covers it.
The reason for the whipsaw comes straight back to size and use. When investors get frightened they buy gold, and the gold market is deep enough to absorb them. Silver, with its tiny investable float and mostly industrial demand, gets hit twice: investment flows are a larger share of a much smaller pool, and a slowdown cuts the industrial half of demand at the same time. So silver falls harder in a panic and rises faster in a boom, which is why the ratio blows out at the bottom of every crisis and compresses at the top of every metals bull market. That is what a small, half-industrial market does, and complaining about it is like complaining that a dinghy rocks more than a ferry.
One more thing keeps silver from responding to price the way a normal commodity would. Only about 28 percent of mined silver comes from primary silver mines, according to the Silver Institute’s 2026 outlook. The rest comes out of the ground as a byproduct of mining something else, mainly lead, zinc and copper. A miner chasing copper does not open or close a pit because silver moved five dollars.
So even with the market in its sixth consecutive annual deficit, which the World Silver Survey forecasts at 46.3 million ounces for 2026 on total demand of about 1.11 billion ounces, new supply barely budges. The gap is being filled by drawing down above-ground stocks, year after year, and that drawdown is the mechanism behind the tightness described in the piece on structural silver deficits. A deficit that large in a market that small is exactly why silver went from under $30 to above $60 in the space of about two years.
Cheap per ounce is not the same as undervalued
This is where I part ways with a lot of what gets written about silver. The argument usually runs: silver is 8 times more abundant than gold but trades at 68 to 1, therefore silver is absurdly cheap and must eventually catch up. The first half is true. The second half assumes the two metals are the same kind of thing, and they are not. Gold is a monetary asset: a $31 trillion stock, a sovereign buyer, hardly any consumption. Silver is an industrial commodity that remembers being money, with a stock that shrinks every year and nobody at a central bank waiting to buy it.
What the ratio does tell you is where silver sits in its own historical range, and 68 is not extreme. Every time the ratio has touched 100, silver was cheap relative to gold and went on to outperform. At 17, in January 1980, it was weeks away from the worst crash in its history. At 68 it is a little above the long-run middle: unremarkable by silver’s own standards, however startling it looks next to gold.
What silver’s low price means if you are buying it
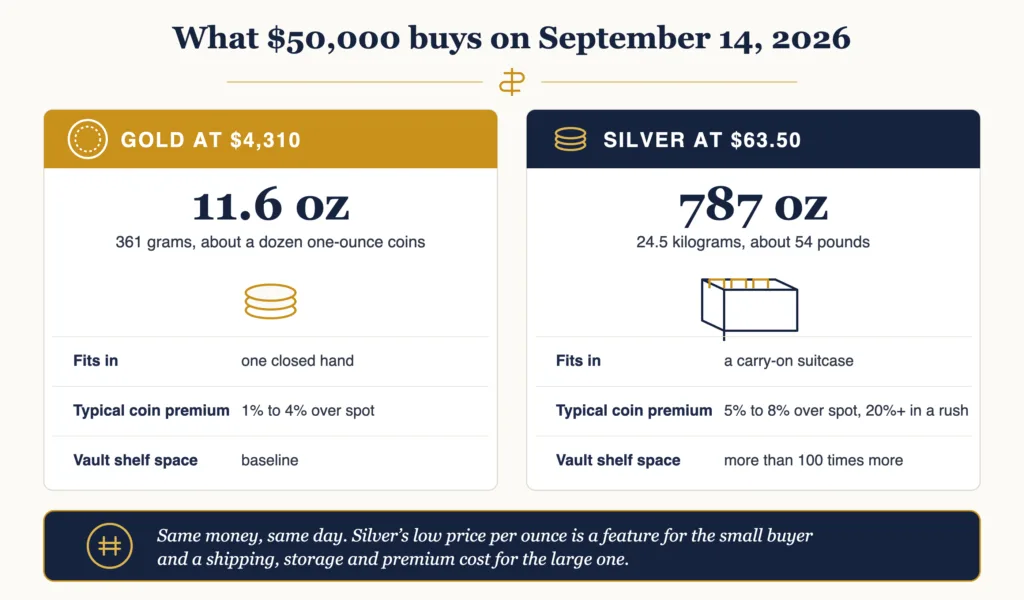
A low price per ounce has consequences most first-time buyers do not expect, and they cut both ways. At $63.50, $50,000 buys about 787 ounces of silver, which weighs 24.5 kilograms, about 54 pounds. The same money buys 11.6 ounces of gold, which is 361 grams and fits in a closed hand. That bulk shows up in every cost that scales with weight rather than value. Insured shipping on 54 pounds of metal is a real line item, and vault storage is usually priced as a percentage of value, but silver is both cheaper per ounce and half as dense as gold, so it takes up well over a hundred times the shelf space per dollar.
Premiums work the same way. Minting and distributing a one-ounce coin costs about the same whether the metal inside is worth $63 or $4,310, so the fixed cost lands much harder on silver. Through the summer of 2026 a one-ounce American Silver Eagle has carried a dealer premium of 5 to 8 percent over spot, and it went above 20 percent during the 2020 and 2021 buying rushes, while a one-ounce Gold Eagle usually runs 1 to 4 percent. The cheapest routes into silver, generic bars and pre-1965 U.S. coins, exist because they strip that fixed cost down to almost nothing, which is the whole case made in the guide to 90 percent junk silver.
The flip side is that silver’s low unit price is what makes it useful. You can spend $70 and own a real ounce of precious metal. And if the ratio ever does swing back toward its historic middle, holding some silver alongside gold is the only way to be there for it. Silver is cheap for old reasons that are not going anywhere. It is common, it gets used up, and the world’s governments walked away from it 150 years ago. None of that makes it a worse asset than gold, just a different one, and I would much rather own it knowing that than because a chart said it was due.