
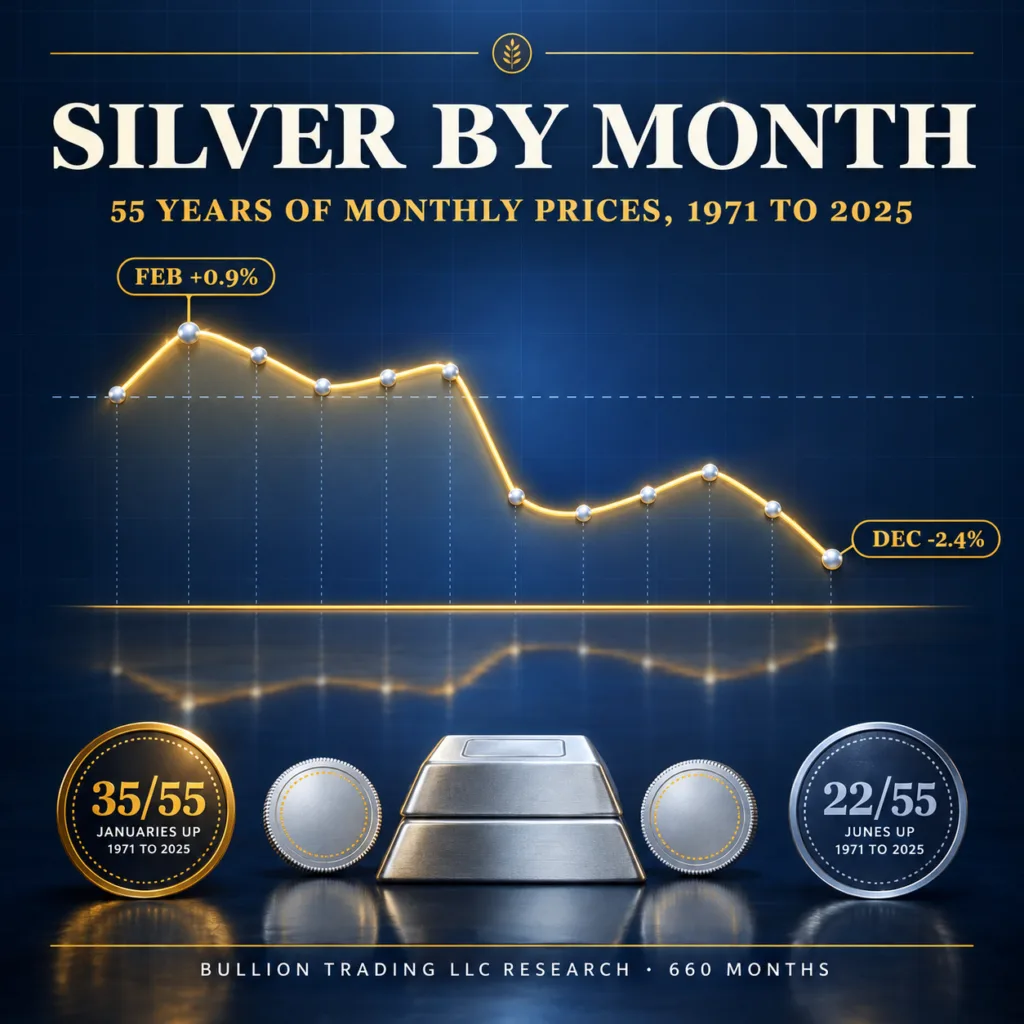
There is no best month to buy silver that reliably beats the rest, though 55 years of prices show a lean. According to World Bank monthly average silver prices from 1971 to 2025, silver rose most often in January, in 35 of 55 years (64%), and least often in June, in 22 of 55 (40%). Against its 12-month moving average, it sat lowest in December, 2.4% below at the median, and below trend in every month from July to December. The 12 months do not differ significantly (Kruskal-Wallis test, p = 0.32), and silver typically moves 3.5% in a single month. A 2024 study of daily London prices from 1981 to 2022 also found June weak for silver, though not in its post-2010 sample.
| Key finding | Result |
|---|---|
| Months studied | 660, covering 55 years from 1971 to 2025 |
| Month silver rose most often | January: 35 of 55 years (64%), median +1.4% |
| January since 1998 | Rose in 21 of 28 years (75%) |
| Weakest month | June: rose in 22 of 55 years (40%), median -0.9% |
| Lowest relative to trend | December, 2.4% below trend (median); every month from July to December sat below trend |
| December against the following February | December’s average was lower in 37 of 55 years (67%), the most of any month; not significant after allowing for 12 months tested |
| Do the 12 months really differ? | Not statistically significant (Kruskal-Wallis test, p = 0.32) |
| January’s record on its own | Not statistically significant even tested alone (p = 0.06; 0.70 after allowing for 12 months tested) |
| Typical size of a monthly move | 3.5% up or down (median absolute change), against 2.2% for gold over the same months |
Bullion Trading LLC research using World Bank monthly average silver prices. Method below.
Is there a best month to buy silver?
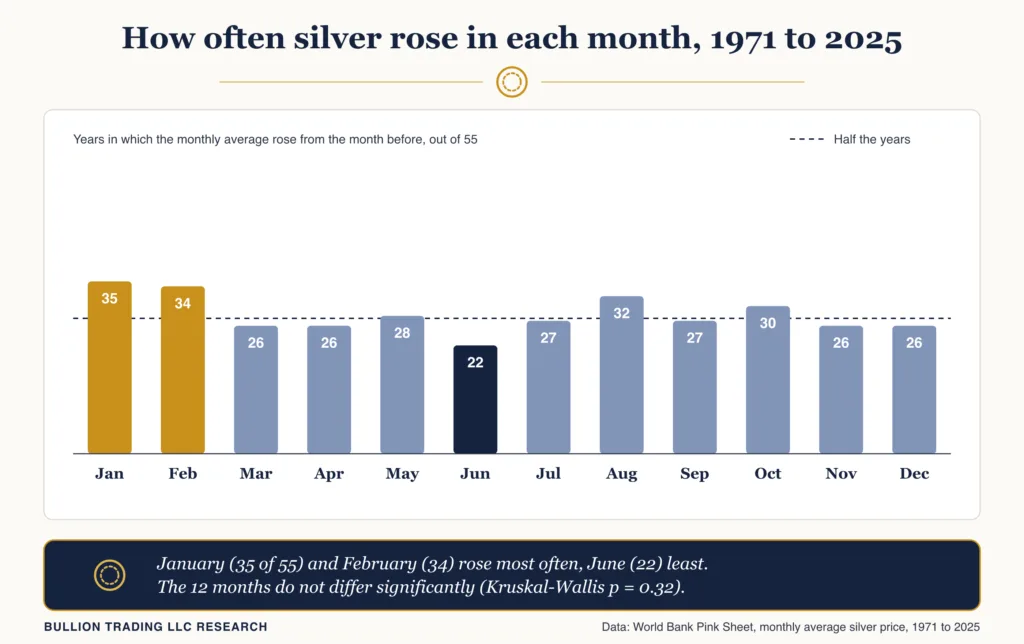
January and February are the months silver most often went up, and June the month it most often went down. Comparing each month’s average price with the month before, silver rose in 35 of 55 Januaries and 34 of 55 Februaries, and February had the larger median gain, 1.7% against January’s 1.4%. August came third with 32 rises. June rose in only 22 years, with a median fall of 0.9%. Across all 660 months silver rose 339 times, about 51%, so most months sit near a coin flip.
The January lean belongs mostly to the past three decades. Silver rose in 21 of 28 Januaries from 1998 to 2025 but in only 14 of 27 from 1971 to 1997, when August led with 17.
Silver by month: the full table
Each month’s full 55-year record is in this table.
| Month | Rose / fell (of 55) | Median change | Rose 1998 to 2025 (of 28) | Price vs trend (median) | Year’s low / high (of 55) |
|---|---|---|---|---|---|
| January | 35 / 20 | +1.4% | 21 | -0.5% | 13 / 8 |
| February | 34 / 21 | +1.7% | 18 | +0.9% | 5 / 8 |
| March | 26 / 29 | -0.6% | 12 | +0.6% | 3 / 4 |
| April | 26 / 29 | -0.2% | 14 | +0.1% | 1 / 5 |
| May | 28 / 27 | +0.3% | 13 | +0.3% | 2 / 5 |
| June | 22 / 33 | -0.9% | 13 | +0.5% | 3 / 2 |
| July | 27 / 28 | -0.6% | 15 | -1.8% | 4 / 5 |
| August | 32 / 23 | +1.3% | 15 | -2.0% | 1 / 2 |
| September | 27 / 28 | -0.9% | 14 | -1.7% | 3 / 2 |
| October | 30 / 25 | +0.2% | 14 | -1.3% | 1 / 2 |
| November | 26 / 29 | -0.7% | 14 | -1.8% | 5 / 3 |
| December | 26 / 29 | -0.2% | 14 | -2.4% | 14 / 9 |
World Bank monthly average silver prices, 1971 to 2025; change is from the previous month, and trend is a centered 12-month average. Bullion Trading LLC research.
When silver has sat lowest against its trend
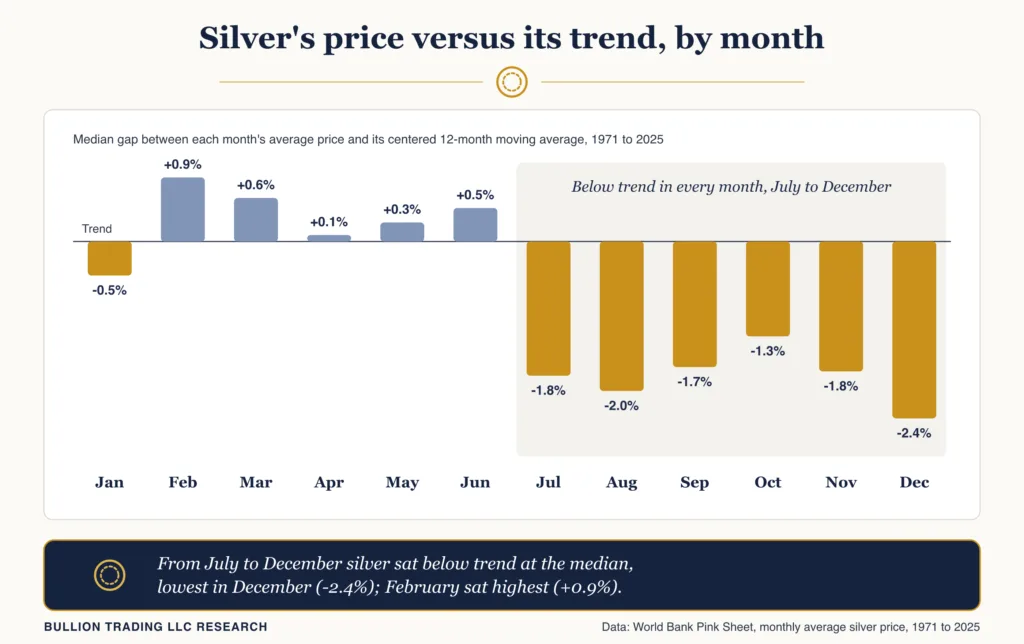
Silver’s price against its 12-month trend shows where in the year prices have tended to sit. Measured against a 12-month average centered on each month, silver sat below trend at the median in every month from July to December, lowest in December at 2.4% below, and highest in February at 0.9% above. The July-to-December dip appears in both halves of the record, though the lowest month was December from 1971 to 1997 and October from 1998 to 2025, and in 38 of 55 years those six months sat lower against trend than January to June.
December was also the year’s lowest month in 14 of 55 years and January in 13, more than any other month. That is partly arithmetic, since the low comes early in a rising year and late in a falling one. Shuffling the order of each year’s 11 within-year moves, we would expect about 11.6 January lows and 10.4 December lows, so both run above what trend explains, December by more.
Old silver calendar sayings, tested
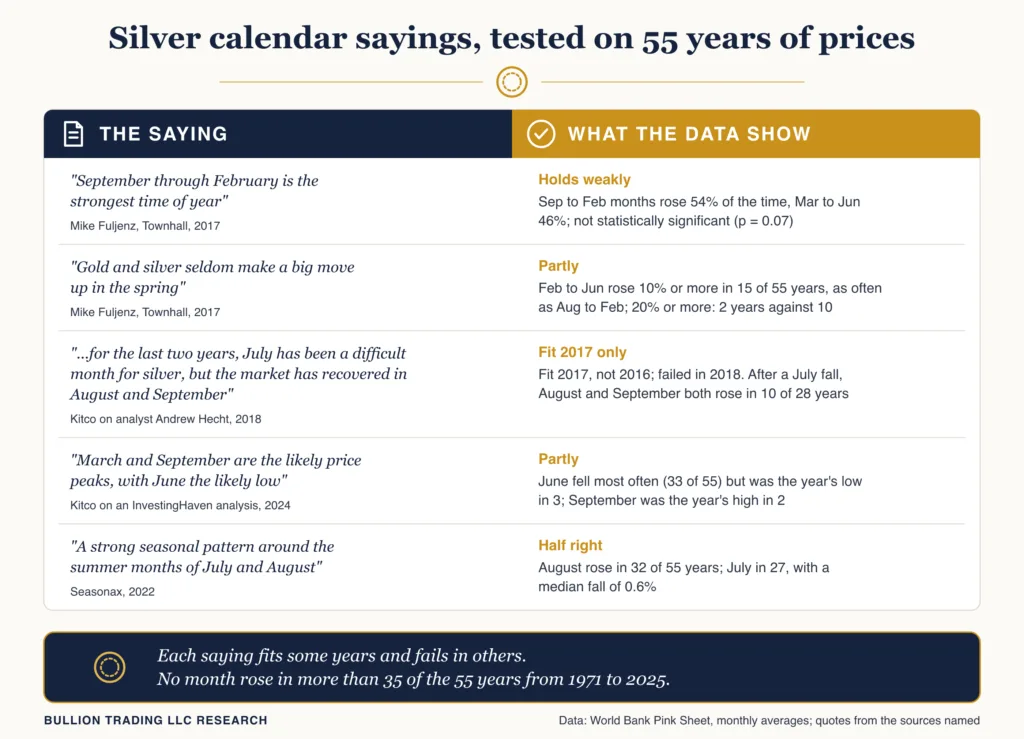
In a 2017 Townhall column, Mike Fuljenz wrote that “September through February is the strongest time of year for the precious metals, historically”, and that “gold and silver seldom make a big move up in the spring”. For silver, the first claim holds weakly: it rose in 54% of September-to-February months (178 of 330) against 46% of March-to-June months (102 of 220), a gap short of statistical significance (Mann-Whitney test, p = 0.07). The second is only partly right. Silver’s average rose 10% or more from February to June in 15 of 55 years, as often as over the six months from August to February, though rises of 20% or more were rarer in spring (2 years against 10).
In August 2018, Kitco reported that commodity analyst Andrew Hecht “noted that for the last two years, July has been a difficult month for silver, but the market has recovered in August and September”. On monthly averages, 2017 fits: July fell 4.6%, then August rose 5.0% and September 2.8%. 2016 does not, as July’s average rose 15.7% and August and September slipped. In 2018 the recovery never came, with silver’s average down 4.7% to 4.9% in each of July, August and September. Of the 28 Julys that fell from 1971 to 2025, 10 were followed by gains in both August and September.
A 2024 Kitco story summarized an InvestingHaven analysis as showing that “March and September are the likely price peaks, with June the likely low for the gray metal”. June fits as the month silver most often fell, yet it was the year’s low in only 3 of 55 years and sat 0.5% above trend at the median, while September was the year’s high in just 2 years and sat 1.7% below trend. Seasonax wrote in 2022 that silver and gold “typically have a strong seasonal pattern around the summer months of July and August”. August fits, with 32 rises in 55 years; July, with 27 and a median fall of 0.6%, does not.
2026, outside our study period, partly fit the pattern: silver’s monthly average jumped about 48% in January, fell 14.5% in June and 11.8% in July, and rose 11.2% in August, but it also fell about 11% in February. Those swings tracked a run of record monthly averages, in World Bank data back to 1960, and its unwinding, covered in our study of silver after record highs. On October 27, 2026, Reuters put spot silver at $53.23 per ounce.
What researchers and the demand calendar show
Academic studies of silver’s calendar find a weak June in some periods and no stable rule. Marcin Potrykus and Urszula Augustynowicz’s 2024 replication of Dirk Baur’s study of gold’s “autumn effect”, using daily London prices from 1981 to 2022, found that for silver “such a month with negative rates is June”, but that “this effect is no longer observed for the most recent research sample”, December 2010 to July 2022, when September (and, more weakly, November) showed significant negative returns instead. A 2019 study of prices from 1995 to 2015 reported “the absence of the monthly effect on gold, silver, platinum, copper markets”.
Physical demand runs on several calendars at once. Industrial uses took 657.4 million of the 1,130.6 million ounces of silver demand in 2025, about 58% by our arithmetic, according to the Silver Institute’s World Silver Survey 2026. The survey says that in India “more than half of the imports arrived in the last four months of 2025”, driven by festive and investment demand, while China’s solar installations were “front-loaded”, with 63% of 2025’s total in the first five months. Festive buying does not always arrive on cue: as Reuters reported in October 2026 that India had issued permits to import around 6,500 metric tons of silver over six months, a Mumbai-based dealer told the agency, “The festive season is here, but demand is yet to pick up”.
Silver also tracks gold: from 1971 to 2025 the two metals’ monthly averages moved the same way in 78% of months, and our study of the best month to buy gold found January the month gold rose most often too. Silver’s typical monthly move, 3.5%, was about 1.6 times gold’s 2.2%, the mark of a smaller, mostly industrial market, as our look at why silver is so cheap compared to gold explains.
Bullion Trading research methodology
Prices come from the World Bank’s Pink Sheet monthly silver series, described in its workbook as the London afternoon fixing for 99.9% refined silver, with Handy & Harman prices before July 1976. The current release, of October 2, 2026, rounds silver to the nearest 10 cents, a step of about 6% at 1971 prices that would show no change in 93 of our 660 months, so we used the February 3, 2026 release, which gives silver to three or more decimals in most months through January 2026. Its 780 months from 1960 to 2024 match the January 3, 2025 release exactly, and all 793 months to January 2026 match the current release once rounded. The August to December 2025 trend uses February to June 2026 figures from it.
Each month’s change is its average price against the previous month’s, for every month from January 1971 to December 2025 (660 months, none unchanged). The trend is a centered 12-month moving average (six months either side, with half weight on the two ends), and the gap is the month’s average divided by it.
A Kruskal-Wallis test on all 660 changes gives p = 0.32, and a permutation test with 20,000 shuffles agrees. January’s 35 rises in 55 years has a two-sided binomial p-value of about 0.06, or 0.70 after a Bonferroni correction for 12 months. We spotted the July-to-December pattern after looking at the data, so it carries no p-value. Year lows and highs had no ties. The December-to-February comparison runs from December 1970 to February 2025; its binomial p is about 0.01 alone and 0.17 after allowing for 12 months.
The ranking holds under other choices. Starting in 1968 instead of 1971, January rose in 37 of 58 years and June in 23. Leaving out 1979 and 1980, when, in the USGS’s words, “individual investors attempted to corner the silver market”, January and February each rose in 33 of 53 years and June in 20. Treating moves under 1% either way as flat, January rose 30 times and fell 15, and June rose 17 times and fell 27. On means, February and January lead and June trails, as on medians. Since 1998 the differences are even further from significance (Kruskal-Wallis p = 0.55 on 336 months).
Annual averages of the series are within 2% of the US Geological Survey’s annual average silver price in all 53 years we could compare from 1971 to 2024, using the USGS report above and later Mineral Commodity Summaries, and within 0.6% of the World Silver Survey’s LBMA annual averages for 2008 to 2025. Monthly averages of front-month COMEX futures closes, from Yahoo Finance, moved the same way as the World Bank series in 294 of 300 months from 2001 to 2025. In 2025 the World Bank figures sit within 0.7% of the survey’s LBMA monthly averages except December ($62.34 against $64.34), with every month’s direction the same. The full dataset is a CSV download.
What this means if you are buying silver
The calendar offers at most a lean. The median gap between February, the month furthest above trend, and December, the furthest below, is about 3.3 percentage points, less than silver’s typical move in a single month, so one bad month can erase it. Many buyers skip the timing question by spreading purchases through the year, an approach our guide to dollar-cost averaging into gold and silver explains.
Frequently asked questions
What is the cheapest month to buy silver?
No month is reliably cheapest. Against its trend, December sat lowest, 2.4% below at the median, in Bullion Trading LLC research on monthly averages from 1971 to 2025, and July to November also sat below trend.
Does silver go up in January?
More often than not. Silver’s monthly average rose in 35 of 55 Januaries from 1971 to 2025, and in 21 of the 28 from 1998 to 2025. It still fell in 20 Januaries, and January’s record is not statistically significant.
Is silver cheaper in the summer?
Slightly, by late summer. June is the month silver most often fell, in 33 of 55 years from 1971 to 2025, and July to September sat below trend at the median by 1.7% to 2.0%, gaps smaller than silver’s typical monthly move of 3.5%.