
| Key finding | Result |
|---|---|
| Chairs studied | 7, from Arthur Burns (February 1970) to Jerome Powell (May 2026) |
| Months studied | 676, February 1970 to May 2026 |
| Gold higher in dollars | Under all 7 on our main measure; Yellen’s 7% gain becomes a 0.4% loss if measured from her first full month |
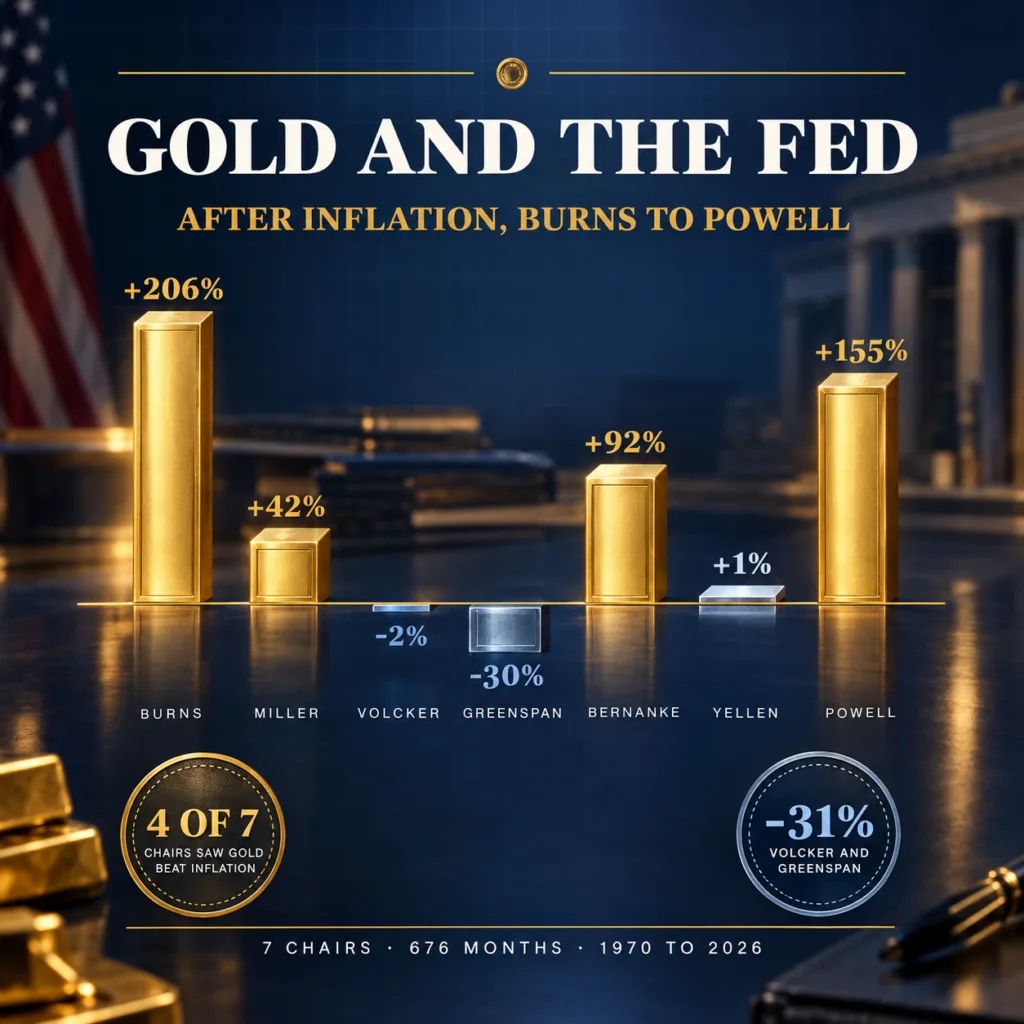
| Gold beat inflation | Under 4 of 7: Burns +206%, Miller +42%, Bernanke +92%, Powell +155% |
| Gold roughly matched inflation | Under Yellen: +1%, between -5% and +1% depending on how her tenure is measured |
| Gold lost to inflation | Under Volcker (-2%) and Greenspan (-30%) |
| Volcker and Greenspan combined | July 1979 to January 2006: gold +87%, consumer prices +171%, gold -31% after inflation |
| Fastest gain after inflation | Miller, +28.3% a year over 17 months |
| Average real federal funds rate | Volcker +4.4 points, Greenspan +1.7; the other five between -0.9 and +0.1 |
| Under Kevin Warsh so far | Monthly average down about 6%, from $4,587 in May 2026 to $4,319 in September 2026 |
Bullion Trading LLC research using World Bank monthly average gold prices, the BLS CPI-U and the Federal Reserve’s H.15 rates. Method below.
How gold did under each Fed chair
Gold’s record under the seven Fed chairs since 1970 falls into three eras. Under Burns and G. William Miller, gold’s monthly average rose more than eightfold, from $34.94 to $294.74. Under Volcker and Greenspan it lost ground to inflation for a quarter century, and under Bernanke, Yellen and Powell it gained again. Chained together, the seven tenures take gold from $34.94 in January 1970 to $4,587 in May 2026, a 131-fold rise in dollars and about 15-fold after inflation.
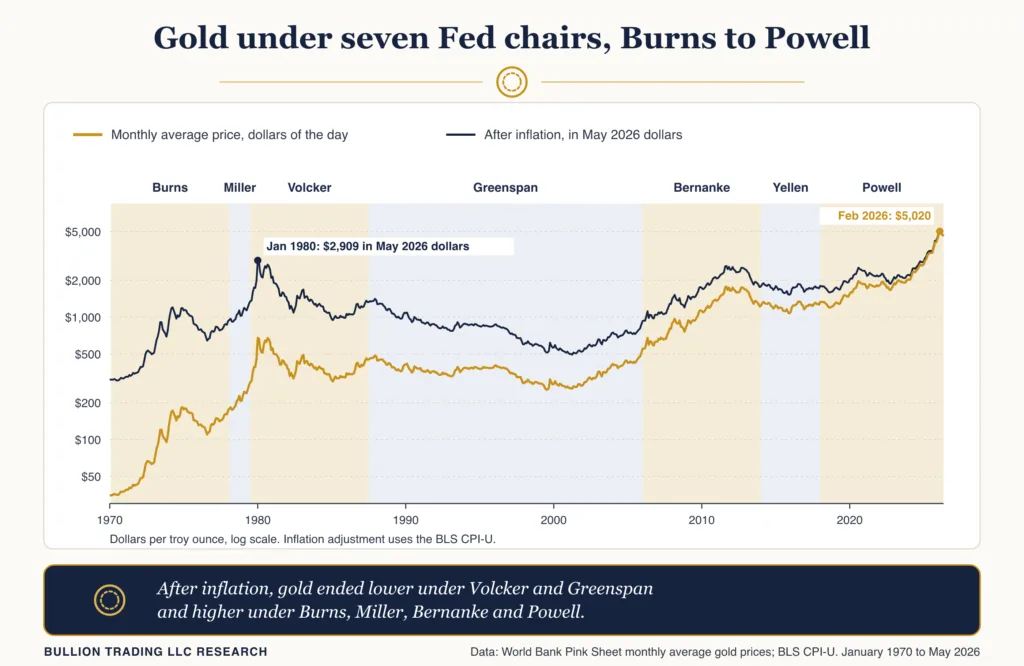
Each tenure runs from the monthly average of the month before the chair took office to that of the chair’s last month, so the periods join end to end.
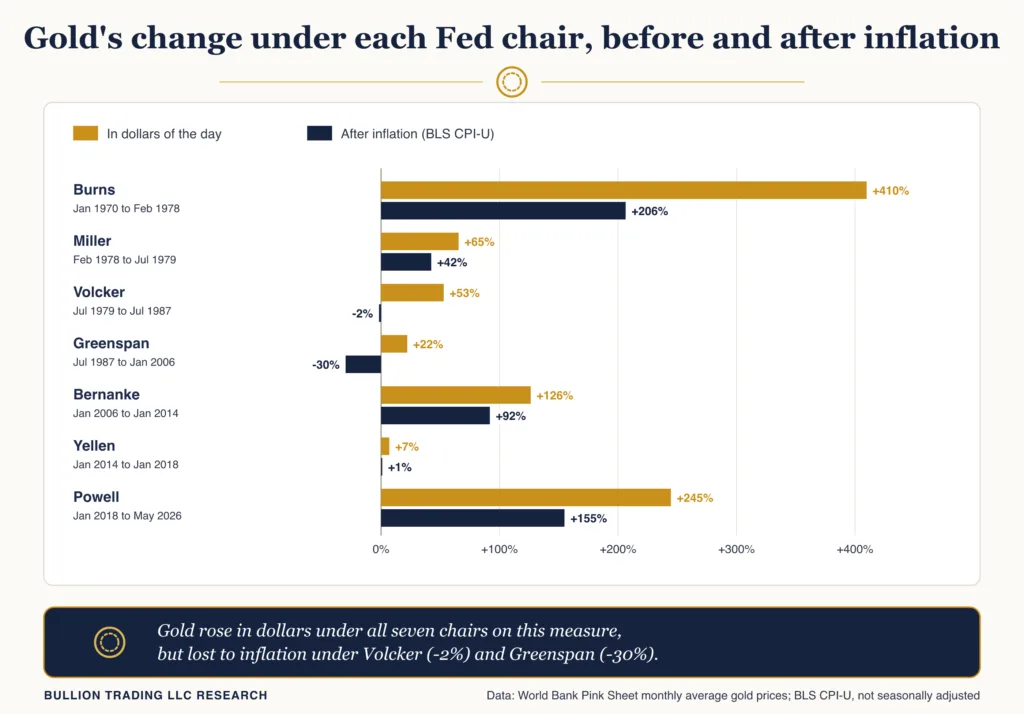
| Chair | In office | Gold, monthly average | Change in dollars | After inflation | After inflation, per year | Average real fed funds rate |
|---|---|---|---|---|---|---|
| Arthur Burns | Feb 1970 to Mar 1978 | $34.94 (Jan 1970) to $178.14 (Feb 1978) | +410% | +206% | +14.9% | 0.0 |
| G. William Miller | Mar 1978 to Aug 1979 | $178.14 to $294.74 (Jul 1979) | +65% | +42% | +28.3% | +0.1 |
| Paul Volcker | Aug 1979 to Aug 1987 | $294.74 to $450.52 (Jul 1987) | +53% | -2% | -0.2% | +4.4 |
| Alan Greenspan | Aug 1987 to Jan 2006 | $450.52 to $549.86 (Jan 2006) | +22% | -30% | -1.9% | +1.7 |
| Ben Bernanke | Feb 2006 to Jan 2014 | $549.86 to $1,244.27 (Jan 2014) | +126% | +92% | +8.5% | -0.7 |
| Janet Yellen | Feb 2014 to Feb 2018 | $1,244.27 to $1,331.30 (Jan 2018) | +7% | +1% | +0.2% | -0.9 |
| Jerome Powell | Feb 2018 to May 2026 | $1,331.30 to $4,587 (May 2026) | +245% | +155% | +11.9% | -0.9 |
| Kevin Warsh (so far) | May 2026 to present | $4,587 to $4,319 (Sep 2026) | -6% | -6% | Too early | +0.2 |
Monthly average gold prices from the World Bank Pink Sheet; inflation from the BLS CPI-U (not seasonally adjusted); real fed funds rate is the Federal Reserve H.15 effective rate minus 12-month CPI inflation, averaged over the tenure, in percentage points. Bullion Trading LLC research.
Burns and Miller: gold’s Great Inflation decade, 1970 to 1979
Arthur Burns took office on February 1, 1970, with gold averaging $34.99 that month. On the evening of August 15, 1971, President Nixon announced a plan that, as Federal Reserve History puts it, “ended dollar convertibility to gold”, a night our Nixon Shock explainer details. Inflation, a little more than 1% a year in 1964, “reached more than 14 percent in 1980”. Over his whole tenure the real federal funds rate averaged almost exactly zero, and gold rose 410% in dollars and 206% after inflation, including a 40% fall from December 1974 ($183.78) to August 1976 ($109.93).
G. William Miller’s 17 months, from March 8, 1978, to August 6, 1979, were the shortest of any chair in the study and the best for gold per year. Federal Reserve History says “Miller argued that the Federal Reserve should take measures to encourage investment instead of fight rising prices”, and he left to become Treasury secretary. Gold’s monthly average rose from $178.14 to $294.74, a 65% gain, or 43% a year; after inflation that is 28.3% a year.
Volcker and Greenspan: a quarter century of gold losing to inflation
Paul Volcker became chair on August 6, 1979. Two months later, at a rare Saturday evening press conference on October 6, 1979, he said the Fed would manage the volume of bank reserves instead of the day-to-day federal funds rate, which, Federal Reserve History says, “reached a record high of 20 percent in late 1980” (the H.15 monthly average peaked at 19.1% in June 1981). Gold peaked early in his term: its monthly average hit $675.31 in January 1980, and the US Geological Survey dates the daily high of $850 per troy ounce to January 21 of that year. It then fell 56% to $299.10 by February 1985. Over his eight years, gold rose 53% in dollars while consumer prices rose 56%, a 2% loss after inflation. The real federal funds rate averaged 4.4 points and was positive in 87 of his 96 months.
Alan Greenspan served longest of the seven, 222 months from August 1987 to January 2006, and gold did worst after inflation. Its monthly average rose 22% while consumer prices rose 74%, a 30% loss after inflation, with the real federal funds rate averaging 1.7 points. Gold’s lowest monthly average of his tenure was $256.08 in July 1999. Two months later, a joint statement on gold published by the European Central Bank capped the signatories’ sales over the next five years: they “will not exceed 2,000 tons”. January 1980’s monthly average of $675.31 was first topped, by 8 cents, in May 2006, under Bernanke, and after inflation not until February 2025, under Powell, the date our study of gold after record highs also found. Our look at gold and interest rates over 50 years covers that long decline in both.
Bernanke, Yellen and Powell: zero rates and gold above $5,000
Ben Bernanke’s eight years, from February 2006 to January 2014, spanned the financial crisis, and gold more than doubled. In November 2008 the Fed announced it would purchase mortgage-backed securities, and on December 16, 2008, it set “a target range for the federal funds rate of 0 to 1/4 percent”. Gold’s monthly average peaked at $1,772.14 in September 2011. Asked about gold’s fall at a Senate hearing on July 18, 2013, Bernanke said “nobody really understands gold prices, and I do not pretend to really understand them either”. Over his tenure gold rose 126% in dollars and 92% after inflation, with an average real federal funds rate of -0.7 points.
Janet Yellen’s four years were the flattest for gold. Her Fed decided on December 16, 2015, “to raise the target range for the federal funds rate to 1/4 to 1/2 percent”, and that month gold averaged $1,075.74, its lowest of her tenure. From January 2014 to January 2018 gold rose 7% in dollars and 1% after inflation.
Jerome Powell’s tenure, from February 5, 2018, to May 22, 2026, brought gold’s second-largest percentage gain, after Burns. The Fed cut its target range “to 0 to 1/4 percent” on March 15, 2020, began raising it on March 16, 2022, and started lowering it again on September 18, 2024. Gold’s monthly average reached $5,020 in February 2026, the highest in World Bank data back to 1960, a month after spot gold touched $5,594.82 and February futures an all-time high of $5,626.80 on January 29, Reuters reported. From January 2018 to May 2026 gold rose 245% in dollars and 155% after inflation.
Bullion Trading research methodology
Gold prices are the World Bank’s Pink Sheet monthly series, which its workbook describes as a spot average of daily rates from June 2025 and, before that, the average of daily London afternoon fixing prices. Recent releases round gold to whole dollars, so we used the February 3, 2026 release at full precision through January 2026 and the October 2, 2026 release after that, and checked that the newer release equals the older one rounded, in all 793 months they share. Inflation is the BLS CPI-U, not seasonally adjusted (series CUUR0000SA0); after the 2025 government shutdown, “October 2025 indexes were not published” for most series, this one included, so that month is left out of the rate averages and interpolated on the first chart. The real federal funds rate is the Federal Reserve’s H.15 monthly effective rate minus the CPI’s 12-month change, averaged over each chair’s months.
Chair dates come from the Federal Reserve Board’s list of chairs. Each month belongs to the chair in office on the 15th. Burns’s term is listed as ending January 31, 1978, but he served as chairman until March 8, 1978, so February 1978 counts under him; Powell’s months run through May 2026, since the Board named him chair pro tempore on May 15 and Warsh took the oath of office on May 22. Per-year figures compound over the tenure’s months. We rounded half up; Powell’s 245% is 244.55% before rounding.
Measuring from each chair’s first full month to the last full month, from the month taken office to the month left, assigning months by the chair in office at month end, or using seasonally adjusted CPI, gold lost to inflation under Volcker in every version (between -16.8% and -1.1%) and under Greenspan (between -31.2% and -30.0%), and beat it under Burns, Miller, Bernanke and Powell. Yellen’s result flips: -0.4% to +7.0% in dollars and -5.0% to +1.2% after inflation.
As an independent check, World Bank annual means match the USGS annual averages of Engelhard gold prices within 1.4% for 1970 to 2021, except 1987, where the USGS figure of $477.95 is higher than 11 of that year’s 12 monthly averages. Monthly averages hide daily extremes, and seven tenures cannot prove cause and effect. The full dataset is available as a CSV download.
Real interest rates and gold under each chair
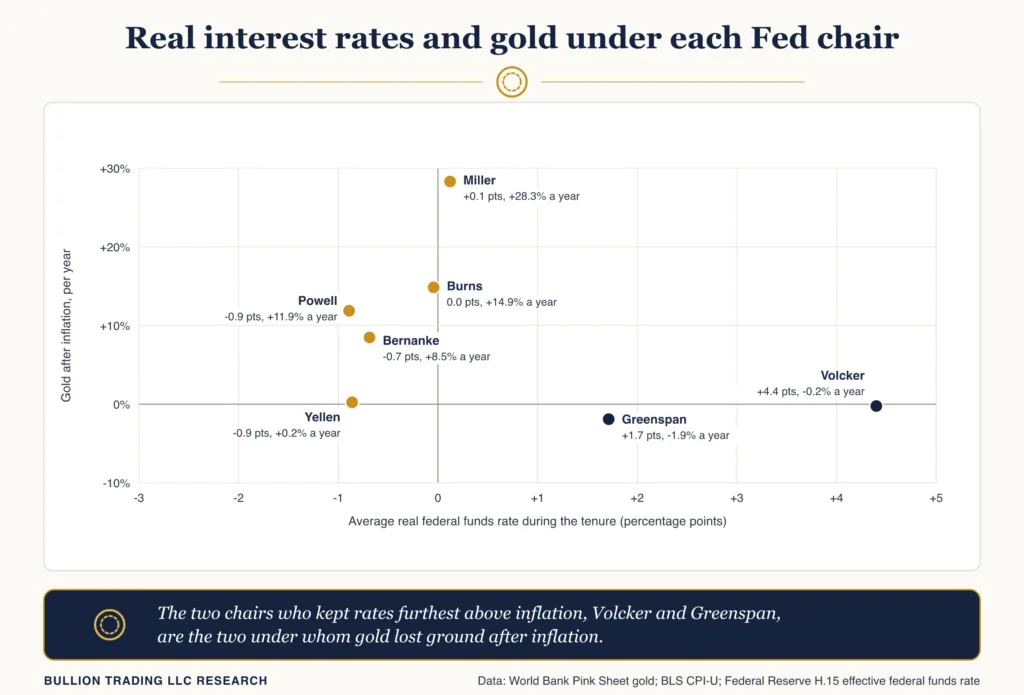
Across the seven tenures, gold’s results line up with one measure of Fed policy: the real federal funds rate, the policy rate minus inflation. Volcker and Greenspan held it furthest above inflation, at 4.4 and 1.7 points on average, and they are the two chairs under whom gold lost purchasing power. Under the other five it averaged between -0.9 and +0.1 points, and gold beat or roughly matched inflation. Yellen fits less neatly: her real rate was among the lowest, yet gold barely moved. Our study of whether gold beats inflation shows how much the start date matters.
Gold’s monthly average rose in the first 12 months of five of the seven tenures, from 0.5% under Yellen to 118% under Volcker, and fell about 3% in the first years of Greenspan and Powell. For the five new chairs since 1979, that is three rises and two falls, less rosy than State Street Global Advisors’ finding that since 1979 “gold performed well in the six to 24 months following the appointment of a new Fed chair”, an average it says Volcker’s start “meaningfully boosts”.
Kevin Warsh took the oath as Fed chair on May 22, 2026. On January 30, when President Trump picked him, gold futures dropped 11.4% to settle at $4,745.10, the AP reported, as our account of the January 2026 gold and silver crash explains. Since he took office, gold’s monthly average has slipped from $4,587 in May to $4,319 in September, about 6%. Four months say little.
Frequently asked questions
Under which Fed chair did gold rise the most?
In percentage terms, Arthur Burns, from 1970 to 1978. Gold’s monthly average rose 410% in dollars, from $34.94 to $178.14, and 206% after inflation. Per year, G. William Miller’s 17 months were faster, at 43% a year in dollars.
Did gold fall under any Fed chair?
Not in dollars, on monthly averages from 1970 to May 2026, although Janet Yellen’s 7% gain turns into a 0.4% loss if her tenure is measured from her first full month. After inflation, gold fell under Paul Volcker (-2%) and Alan Greenspan (-30%).
How has gold done since Kevin Warsh became Fed chair?
Kevin Warsh was sworn in on May 22, 2026. Gold’s monthly average fell from $4,587 in May to $4,319 in September 2026, about 6%. Four months is too short to judge.