
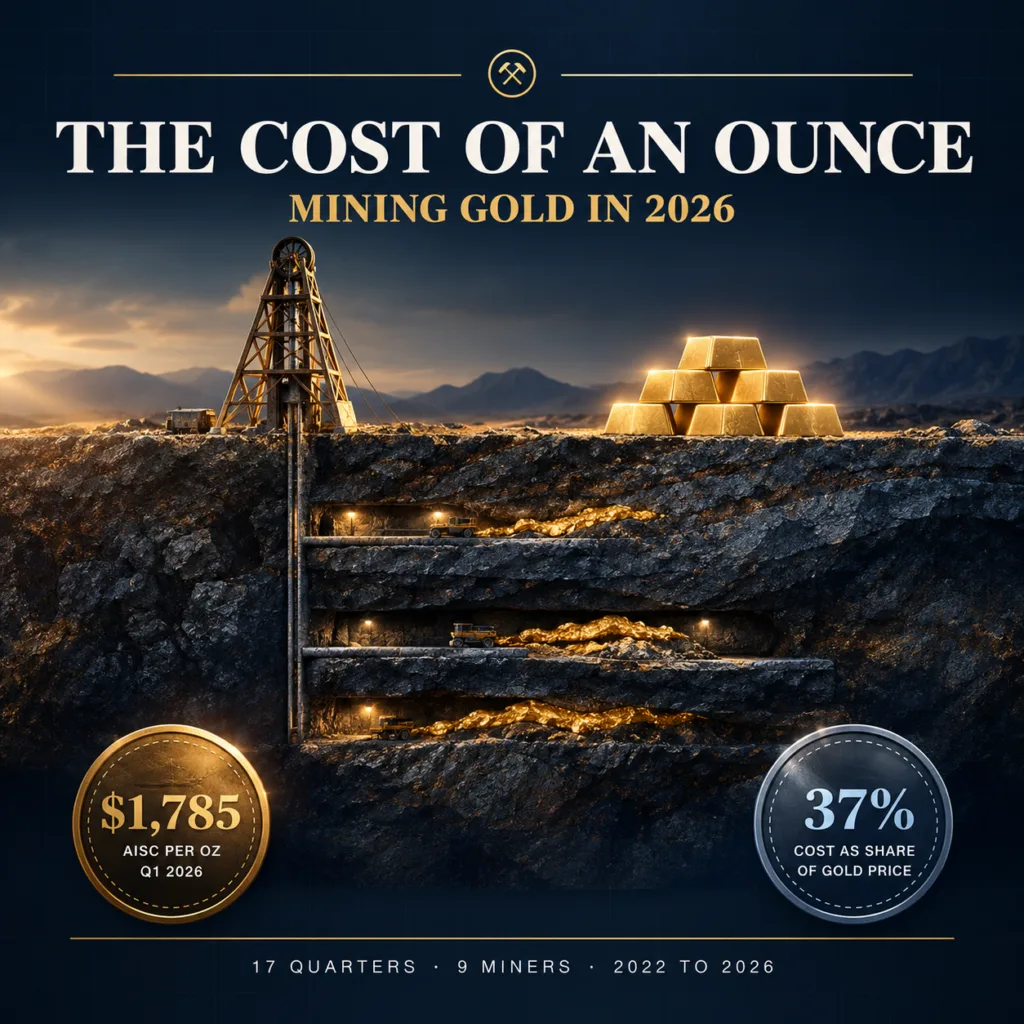
The cost to mine an ounce of gold reached a record $1,785 in the first quarter of 2026, measured by the industry’s all-in sustaining cost, and the gold price grew far faster. Bullion Trading LLC research on World Gold Council data finds that from the first quarter of 2022 to the first quarter of 2026, the average all-in sustaining cost, as first reported each quarter, rose 45%, from $1,232 to $1,785 an ounce, while the average gold price rose 160%, from $1,877 to $4,873. Costs fell from about 66% of the gold price to about 37%. The nine large miners we checked reported costs of $1,454 to $2,244 an ounce in their latest results. That figure covers running a mine, not finding and building one, so the full cost of a new ounce is higher.
| Key finding | Result |
|---|---|
| Industry all-in sustaining cost, Q1 2026 | $1,785 an ounce, a record (World Gold Council) |
| Gold price, Q1 2026 average | $4,873 an ounce (LBMA afternoon price) |
| Cost as a share of the gold price | 66% in Q1 2022, 37% in Q1 2026 (AISC as first reported) |
| Change, Q1 2022 to Q1 2026 | Costs up 45%, gold price up 160% (AISC as first reported) |
| Price minus cost | $645 an ounce in Q1 2022, $3,088 in Q1 2026; lowest $440 in Q3 2022 |
| Year-on-year cost increases | Every quarter in the table with a year-earlier figure, 13 of 13 (the council counts 28 in a row) |
| Nine large miners, latest reports | $1,454 to $2,244 an ounce, median $1,907 |
| Royalties’ share of the average mine’s cost | About 6% in Q1 2021, 12% in Q1 2026 (World Gold Council) |
Bullion Trading LLC research using World Gold Council Gold Demand Trends and company results. Method below.
What it costs to mine an ounce of gold, and how miners measure it
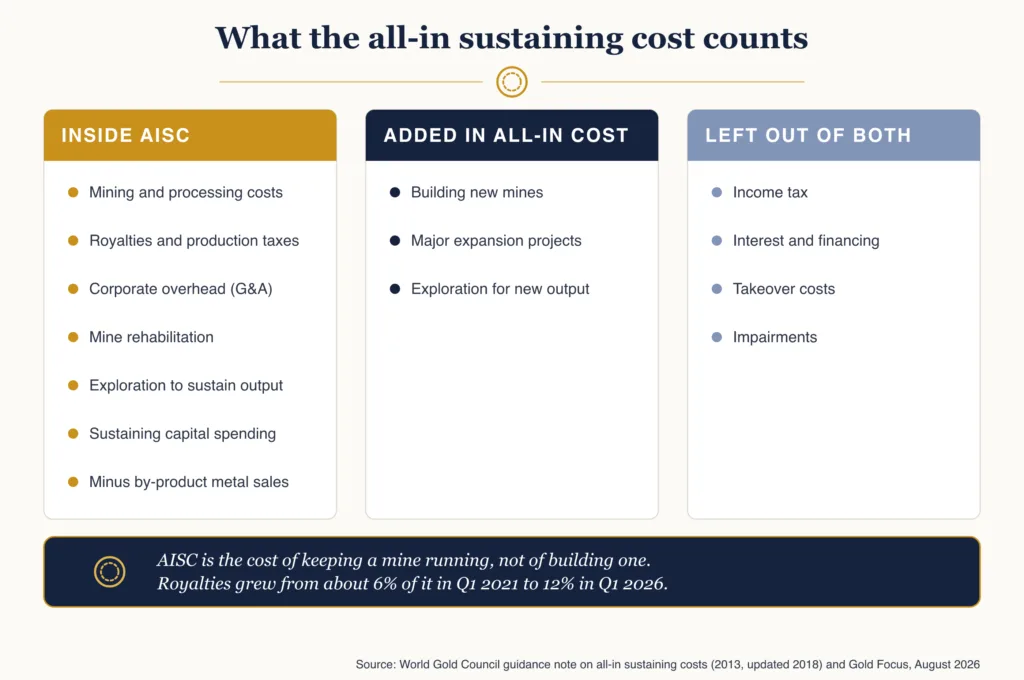
Most large gold miners report their costs using a measure the World Gold Council introduced in June 2013, all-in sustaining cost, or AISC, which it said was intended to provide “further transparency into the costs associated with producing gold”. It starts with the cash cost of mining and processing ore, then adds royalties and production taxes, corporate overhead, rehabilitation, exploration needed to keep output steady, and sustaining capital, and it subtracts sales of by-product metals such as silver or copper. A broader figure, all-in cost, also includes the spending on new operations and major projects. Neither counts income tax, financing costs or impairments, and under the council’s guidance “the initial development of a new open pit or underground mine” is treated as non-sustaining, so it sits outside AISC.
Gold mining costs versus the gold price, 2022 to 2026
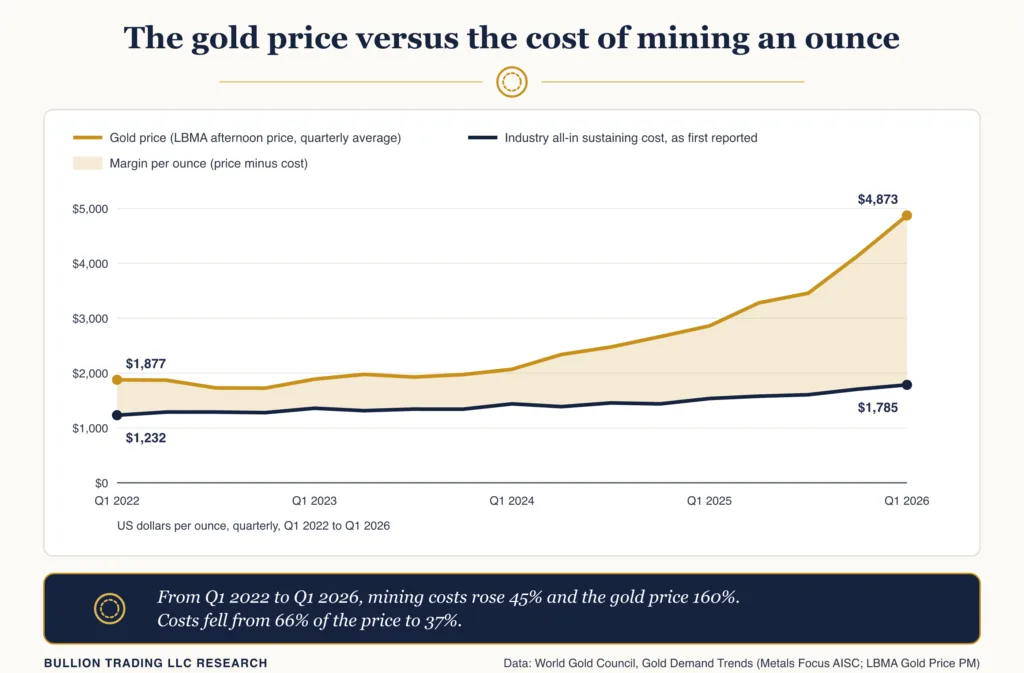
Mining costs have risen steadily while the gold price has risen much faster. The World Gold Council’s quarterly reports put the industry average AISC at $1,232 an ounce in the first quarter of 2022 and $1,785 in the first quarter of 2026, “underpinned by a rise in royalties and corporate G&A expenses”. That was the 28th straight year-on-year increase, the council noted in August 2026, and it expected higher energy prices to have “a greater impact to be seen in Q2’26 and beyond”.
Over the same four years the quarterly average gold price rose from $1,877 to $4,873, so the gap between price and cost grew almost fivefold, from $645 to $3,088 an ounce. The council put the industry’s average margin at a record US$3,076/oz in that quarter and said that even at the 90th percentile of the cost curve, where the costliest tenth of the output the council tracks begins, the AISC margin was about $2,363 an ounce.
| Quarter | Industry AISC per ounce | Gold price (average) | Price minus cost | Cost as share of price |
|---|---|---|---|---|
| Q1 2022 | $1,232 | $1,877 | $645 | 66% |
| Q2 2022 | $1,289 | $1,871 | $582 | 69% |
| Q3 2022 | $1,289 | $1,729 | $440 | 75% |
| Q4 2022 | $1,279 | $1,726 | $447 | 74% |
| Q1 2023 | $1,358 | $1,890 | $532 | 72% |
| Q2 2023 | $1,315 | $1,976 | $661 | 67% |
| Q3 2023 | $1,343 | $1,929 | $586 | 70% |
| Q4 2023 | $1,342 | $1,972 | $630 | 68% |
| Q1 2024 | $1,439 | $2,070 | $631 | 70% |
| Q2 2024 | $1,388 | $2,338 | $950 | 59% |
| Q3 2024 | $1,456 | $2,474 | $1,018 | 59% |
| Q4 2024 | $1,438 | $2,663 | $1,225 | 54% |
| Q1 2025 | $1,536 | $2,860 | $1,324 | 54% |
| Q2 2025 | $1,578 | $3,280 | $1,702 | 48% |
| Q3 2025 | $1,605 | $3,457 | $1,852 | 46% |
| Q4 2025 | $1,706 | $4,135 | $2,429 | 41% |
| Q1 2026 | $1,785 | $4,873 | $3,088 | 37% |
Industry AISC as first reported in each quarter’s World Gold Council Gold Demand Trends (Metals Focus data); gold price is the quarterly average LBMA Gold Price PM from the summary tables of later Gold Demand Trends reports. Bullion Trading LLC research.
What nine large gold miners reported
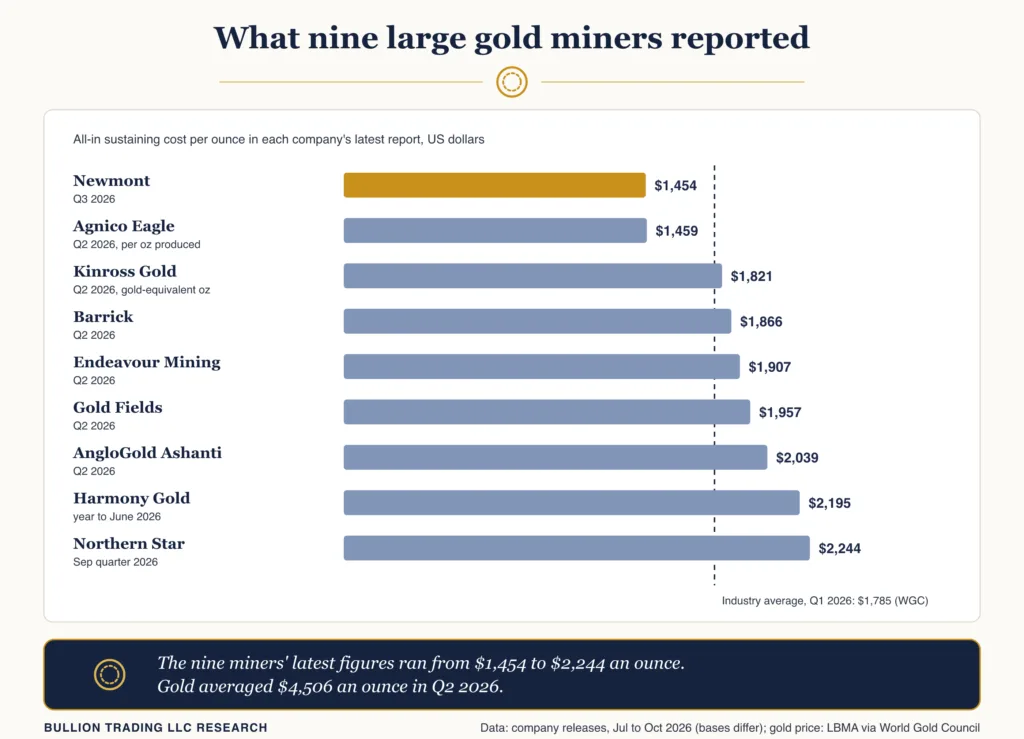
Company figures show the same picture, with a wide spread between miners. These are the latest results we could verify in each company’s own release or filing, as of October 23, 2026. Most are second-quarter figures, when gold averaged $4,506 an ounce.
| Company | Period | AISC per ounce | Basis |
|---|---|---|---|
| Newmont | Q3 2026 | $1,454 | By-product, per ounce sold |
| Agnico Eagle | Q2 2026 | $1,459 | Per ounce produced |
| Kinross Gold | Q2 2026 | $1,821 | Per gold-equivalent ounce sold, attributable |
| Barrick | Q2 2026 | $1,866 | Per ounce sold, attributable |
| Endeavour Mining | Q2 2026 | $1,907 | Per ounce sold |
| Gold Fields | Q2 2026 | $1,957 | Per ounce sold |
| AngloGold Ashanti | Q2 2026 | $2,039 | Per ounce sold, group |
| Harmony Gold | Year to June 2026 | $2,195 | Company’s conversion from R1,191,698/kg |
| Northern Star | September quarter 2026 | $2,244 | Company’s conversion from A$3,217 |
Bases differ, so treat comparisons as approximate. Newmont’s co-product AISC for the same quarter was $1,963. Bullion Trading LLC research from company releases.
The differences are partly about method. Newmont credits copper, silver, lead and zinc sales against its gold costs, which puts its by-product AISC $509 an ounce below its co-product figure for the same quarter. Agnico Eagle divides by ounces produced rather than sold, Kinross counts silver as gold-equivalent ounces, and Harmony and Northern Star report in rand and Australian dollars.
Why the cost of mining gold keeps rising
A higher gold price raises its own production cost through royalties. The World Gold Council found royalties made up about 6% of the average mine’s AISC in the first quarter of 2021 and 12% of the average operation’s cost base five years later. Endeavour Mining said royalties at its realised gold price of $4,348, against the $3,000 its guidance assumed, added +$175/oz to its second-quarter AISC, and Newmont estimates its royalty, production tax and workers’ participation costs move about $6 per ounce for every $100 per ounce change in gold price.
Energy is the other swing factor: in the first quarter of 2026 the average US diesel price rose 54% and Perth wholesale diesel 96%, the council reported, and Barrick puts the direct diesel cost of each $10 per barrel change in the oil price at $12 an ounce. Agnico Eagle said its production costs per ounce rose on higher labour costs, higher royalty costs resulting from higher gold prices, higher energy costs related to diesel and lower production, and its AISC also on higher sustaining capital and reclamation costs.
What all-in sustaining cost leaves out
AISC understates what it takes to add a new ounce of supply. It can take between 10 and 20 years from discovery to production, according to the World Gold Council, and finding gold is getting dearer: MinEx Consulting’s Richard Schodde estimated discovery costs at around $US45 per ounce in 2017, almost double the 2007 level. Income tax and the interest on money borrowed to build a mine are also outside the measure. A miner can report a healthy AISC margin and still lose money once those costs and writedowns are counted. In the last downturn, margins were thin even before them: in mid-2013 Goldcorp’s all-in costs in the quarter were $1,279 an ounce, not far below its $1,358 realized price, and by August that year Barrick Gold and Kinross Gold had taken $21 billion of impairment writedowns since the end of 2011.
Is the cost of mining a floor under the gold price?
Production costs are often described as a floor for the gold price, but the record says they work more like a slow brake. Even in the tight year of 2022, margins only turned negative for the 90th percentile of gold mines, not for the industry, and in the third quarter of 2024 the council found 97% of primary gold production was profitable.
Supply reacts slowly either way: the council estimates that mined output lags the gold price by at least six years, and its April 2026 estimate for 2025 output, 3,815t (up from a first estimate of 3,672t once full-year company figures were in and Metals Focus revised its artisanal-mining data; it revised again in July), was a record even before the 2026 price jump could have any effect. Gold’s price is set mostly by investors and central banks holding existing metal, a theme our look at Gold Demand Trends for 2025 covers, so costs matter most when prices fall toward them, as in 2013.
Bullion Trading research methodology
The quarterly series uses the industry average all-in sustaining cost and the quarterly average LBMA Gold Price PM as printed in World Gold Council Gold Demand Trends reports from 2022 to mid-2026; the AISC figures come from Metals Focus and the prices from ICE Benchmark Administration. Each report gives only the latest quarter’s AISC, and the council’s underlying series is later revised, sometimes by $50 an ounce or more, so the table uses each figure as first reported. Judging by the council’s own reported percentage changes, revisions to individual quarters have run from about $50 an ounce down to about $20 up; a revision in that range to the Q1 2022 figure would put the four-year rise in costs between about 42% and 51%.
The price-minus-cost figure is our simple subtraction, the margin formula the council itself describes, and does not exactly match the council’s own margin figure: for Q1 2026 the council gives the same $1,785 cost but a $3,076 margin, against our $3,088.
Company figures come from each company’s results release or regulatory filing for its latest period as of October 23, 2026; Polyus was left out because its 2026 results could not be reached and the latest release we could read gives total cash cost, not AISC. The quarterly dataset is available as a CSV download.
What mining costs mean for gold buyers
For someone buying coins or bars, the cost of mining is background rather than a price signal. It shows that today’s gold price is far above what it costs to keep the world’s mines running, which is why miners earned record margins in early 2026 and why their shares and the royalty and streaming companies that finance them have done well. It does not mean gold cannot fall: costs were about 37% of the price in the first quarter of 2026, so they would only come into play after a very large decline. Every ounce that reaches a refinery, whatever it cost to dig, goes through the same steps our guide to how gold refining works describes.
Frequently asked questions
How much does it cost to mine an ounce of gold?
About $1,785 on average in the first quarter of 2026, by the industry’s all-in sustaining cost measure reported by the World Gold Council, the latest quarter it had published as of October 2026. The nine large miners we checked reported $1,454 to $2,244 an ounce in their latest results.
What is AISC in gold mining?
All-in sustaining cost is a standard measure, introduced by the World Gold Council in 2013, of the cost of producing an ounce from existing mines, including royalties, overhead and sustaining capital but not new mines, income tax or financing.
Which gold miner has the lowest cost?
Among the nine large miners we checked, Newmont ($1,454, Q3 2026) and Agnico Eagle ($1,459, Q2 2026) reported the lowest AISC, though they calculate it on different bases.