
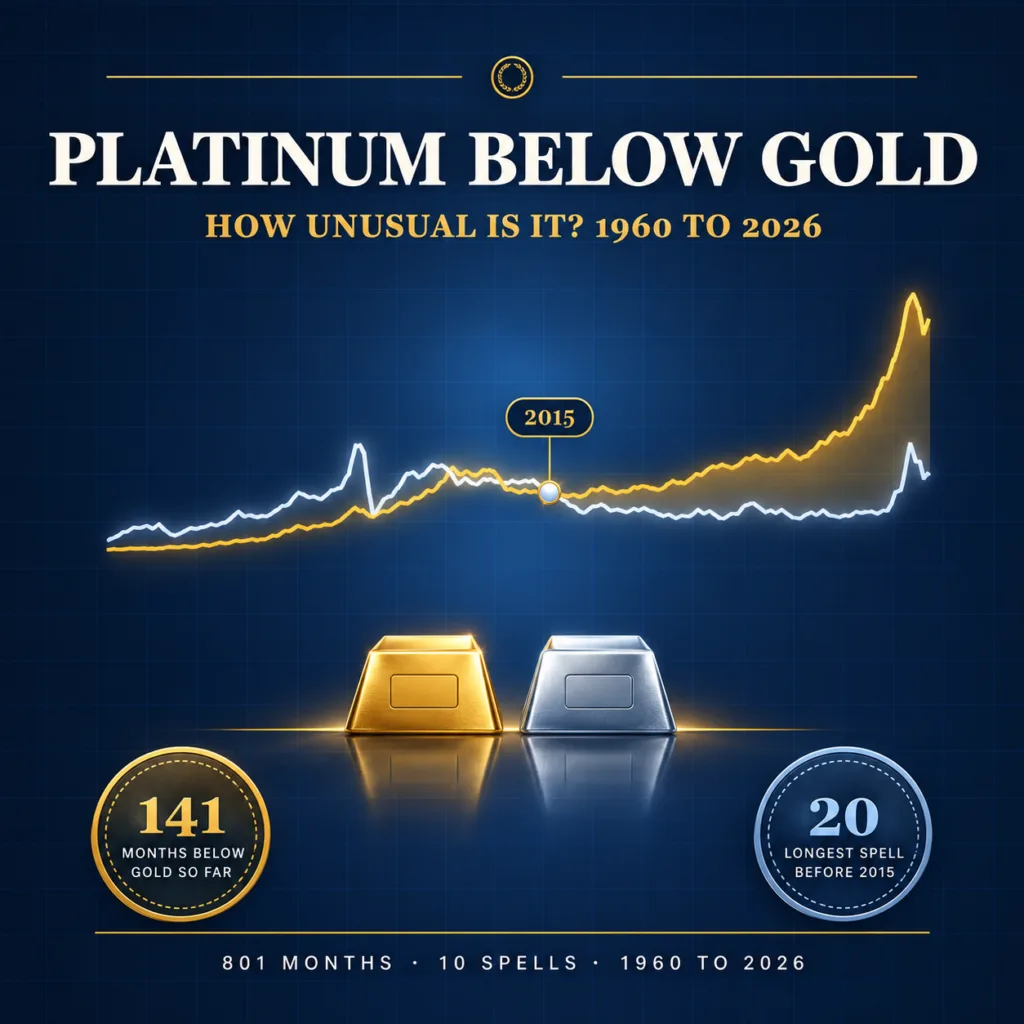
Platinum cheaper than gold for more than a decade has no precedent in the modern record. Bullion Trading LLC research on World Bank monthly prices back to January 1960 finds ten spells in which platinum’s monthly average fell below gold’s. The nine before 2015 lasted between one and 20 months, and the deepest had an ounce of gold buying 1.31 ounces of platinum, in September 1982. The current spell began in January 2015 and had run 141 months by September 2026, seven times the old record, with gold buying as much as 3.38 ounces of platinum in May 2025. Even after platinum set a record monthly average of $2,434 in January 2026, it cost about half as much as gold.
| Key finding | Result |
|---|---|
| Months studied | 801, from January 1960 to September 2026 |
| Spells of platinum below gold | 10, including the current one |
| Longest spell before 2015 | 20 months, September 1981 to April 1983 |
| Current spell | 141 months, January 2015 to September 2026, and continuing |
| Deepest discount before 2015 | 1 ounce of gold bought 1.31 ounces of platinum (September 1982) |
| Deepest discount since 1960 | 1 ounce of gold bought 3.38 ounces of platinum (May 2025) |
| Platinum below gold, 1990 to 2014 | 21 of 300 months (7%) |
| Deeper than any pre-2015 discount | Every month since April 2017, 114 in a row |
| Latest month, September 2026 | Platinum $1,784, gold $4,319: 1 ounce of gold buys 2.42 ounces of platinum |
Bullion Trading LLC research using World Bank monthly average prices. Method below.
How unusual is platinum cheaper than gold?
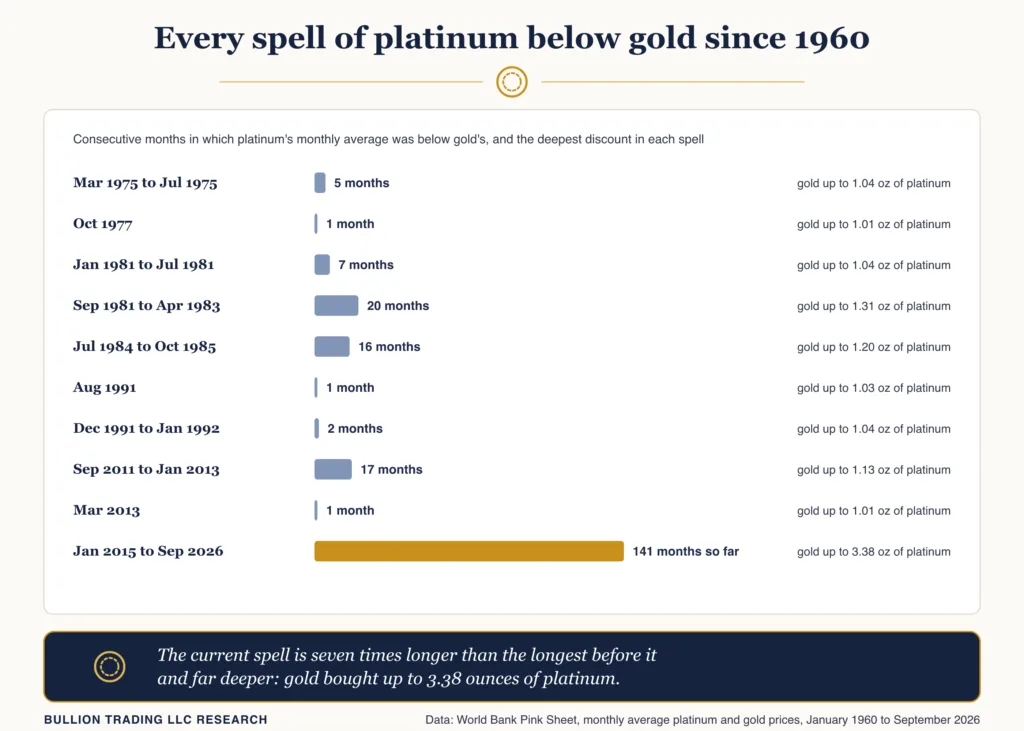
For most of the past 66 years, platinum cost more than gold, often far more. In the 1960s, with gold at or near $35 an ounce until 1968, an ounce of gold bought less than half an ounce of platinum, and from 1990 to 2014 platinum’s monthly average was below gold’s in only 21 of 300 months. Across the whole record, platinum was the cheaper metal in 211 of 801 months, about 26%, but 141 of those belong to the current spell. Before 2015 the inversions were short: four lasted a month or two, and only three ran past a year.
Every spell of platinum below gold since 1960
The table lists all ten spells, the deepest discount in each, and how far each metal moved from that low point until platinum’s monthly average was back above gold’s.
| Spell | Months | Deepest point (oz of platinum per oz of gold) | From the deepest month until platinum was back above gold |
|---|---|---|---|
| Mar 1975 to Jul 1975 | 5 | 1.04 (May 1975) | Platinum +9%, gold -2% |
| Oct 1977 | 1 | 1.01 | Platinum +8%, gold +2% |
| Jan 1981 to Jul 1981 | 7 | 1.04 (Feb 1981) | Platinum -13%, gold -18% |
| Sep 1981 to Apr 1983 | 20 | 1.31 (Sep 1982) | Platinum +34%, gold 0% |
| Jul 1984 to Oct 1985 | 16 | 1.20 (Mar 1985) | Platinum +28%, gold +3% |
| Aug 1991 | 1 | 1.03 | Platinum +5%, gold +1% |
| Dec 1991 to Jan 1992 | 2 | 1.04 (Jan 1992) | Platinum +6%, gold 0% |
| Sep 2011 to Jan 2013 | 17 | 1.13 (Dec 2011) | Platinum +15%, gold -1% |
| Mar 2013 | 1 | 1.01 | Platinum -6%, gold -7% |
| Jan 2015 to Sep 2026 | 141 so far | 3.38 (May 2025) | Still below gold |
Monthly average prices, World Bank Pink Sheet. A spell is a run of consecutive months with platinum’s average below gold’s. Bullion Trading LLC research.
Seven of the nine earlier spells ended mainly because platinum rose. The two long ones in the 1980s closed with platinum up 34% and 28% from their low points while gold barely moved. The US Geological Survey tied the early-1980s weakness to the fact that “in 1981 and 1982, lower world demand for PGMs resulted in lower prices”, and the Christian Science Monitor reported in 1981 that carmakers had bought 517,000 ounces of platinum the year before, down from 803,000 ounces in 1979. Platinum’s premium then widened in 1986, when its price rose 60%, the USGS says, on a strike at Impala Platinum and fears that US imports from South Africa would be cut off.
How deep platinum’s discount to gold has gone
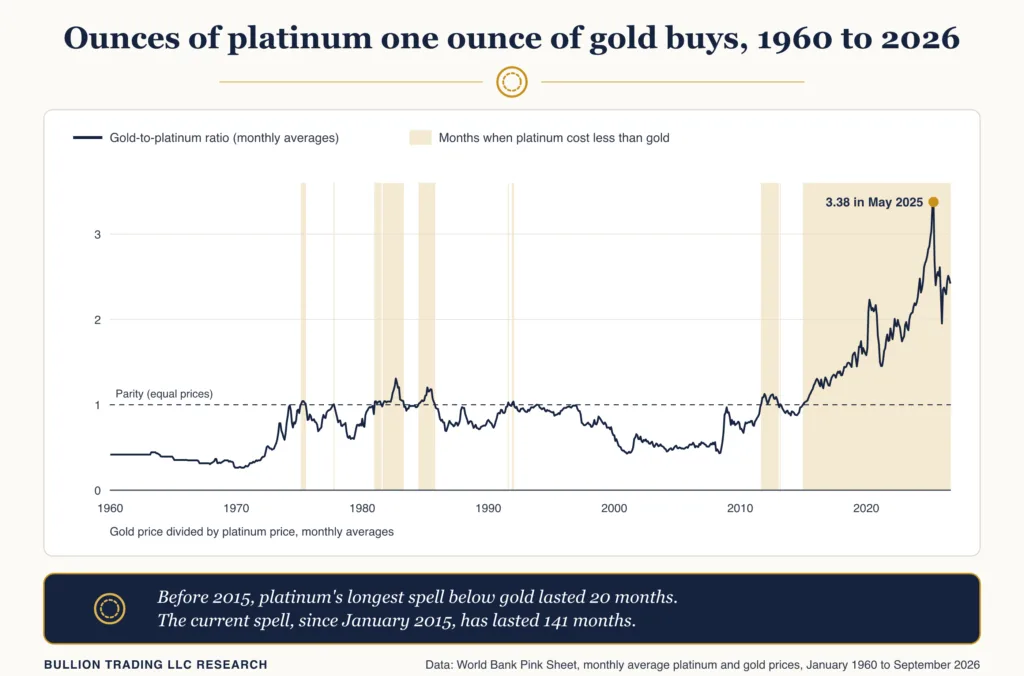
The current spell is not just long but deep. The gold-to-platinum ratio, the number of ounces of platinum one ounce of gold buys, averaged 0.56 in the 2000s, 1.14 in the 2010s and 2.16 so far in the 2020s. It first passed 2 in March 2020 and reached 3.38 in May 2025, when platinum averaged $980 an ounce and gold $3,309. Every month since April 2017 has been deeper than the deepest discount of any earlier spell. As of September 2026, platinum would need to rise about 142% for the two metals to cost the same, if gold stayed where it was.
Why platinum used to cost more than gold
Platinum is far rarer than gold. The US Geological Survey estimates world platinum mine production at about 170 tonnes in 2025, about 120 tonnes of it from South Africa, against an estimated 3,300 tonnes of gold, roughly 19 times as much. Unlike gold, though, most platinum demand comes from cars and industry. Of 8,671,000 ounces of demand in 2025, the World Platinum Investment Council counts 35% automotive, 26% jewellery, 26% industrial and 13% investment. That leaves platinum’s price tied to car sales and factory demand in a way gold’s is not. Jewellery has been a second pillar: around 2000 the USGS called it “a major end use of platinum worldwide (especially in Japan)”, and by 2012 China accounted for 70% of global consumption of platinum for jewelry.
What changed in 2015
In 2015, Europe’s car manufacturers were the top consumers of platinum, and diesel made up half of their market, mining.com reported at the time. On September 18, 2015, the US Environmental Protection Agency issued Volkswagen a Notice of Violation of the Clean Air Act over diesel cars that emitted “up to 40 times more pollution than emissions standards allow”. Four days later, platinum futures for October delivery fell to $935.20 an ounce, a level last seen at the end of 2008.
Diesel’s share of new cars in the EU-15 slipped from 52.1% in 2015 to 49.9% in 2016, the first full year after the scandal, and kept falling: across the whole EU, diesel had an 8.9% share in 2025. Gold, meanwhile, went on to a series of records, so the gap widened from both sides. Platinum was already below gold before the scandal, from January 2015, but the diesel decline helps explain why it stayed there.
The 2025 to 2026 rally, and where things stand
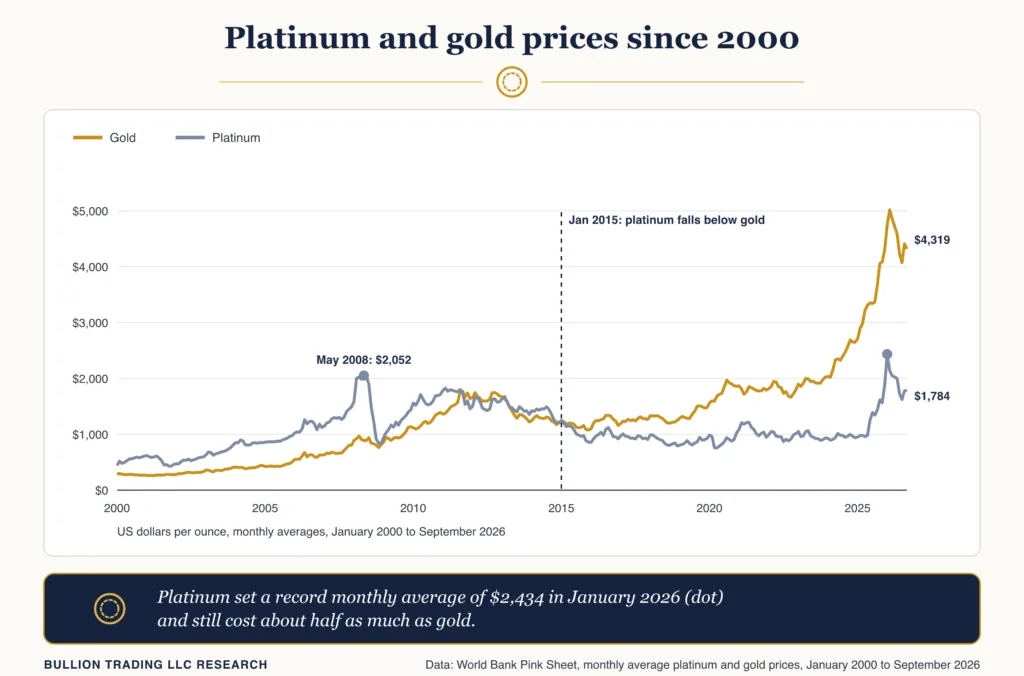
Platinum’s discount to gold, the deepest in the World Bank data, helped set off a rally of 220% from the start of 2025 to the January 2026 peak, by the World Platinum Investment Council’s count. The first leg came in the second quarter of 2025, when, reacting to a record discount to gold, Chinese jewellers rotated towards platinum, the council wrote. Spot platinum rose 127% in 2025 and hit a record $2,918.80 an ounce on January 26, 2026, according to Reuters, well above the March 4, 2008, high of $2,275 per troy ounce reported by the USGS. On monthly averages, January 2026 was platinum’s highest month at $2,434, yet gold averaged $4,753, so platinum still cost about half as much.
Platinum then gave back much of the gain. The council’s latest quarterly report says prices fell 24% in the first half of 2026, and it now expects a 265 koz surplus (previously a 297 koz deficit) for 2026 after three years of deficits. On October 23, 2026, Reuters put spot platinum at $1,557.03 per ounce against $4,026.15 for gold, about 2.6 ounces of platinum per ounce of gold by our arithmetic. Our earlier piece on platinum versus gold as an investment covers the buying side, from coins to IRA rules.
Bullion Trading research methodology
Prices come from the World Bank’s Pink Sheet monthly series for platinum and gold, January 1960 to September 2026, 801 months. The monthly workbook describes platinum as a spot average of daily rates from June 2025 and, before that, the London afternoon fixing, and gold the same way. A spell is a run of consecutive months in which platinum’s monthly average was below gold’s; four months in which the two averages were equal in whole dollars count as neither. The gold-to-platinum ratio is gold’s monthly average divided by platinum’s. The last column of the spells table compares each metal’s change from the spell’s deepest month to the first month platinum was back above gold.
Monthly averages smooth out single days, so the dates differ slightly from daily data: the USGS reports that the two metals reached parity for the first time in 10 years in December 2008, a crossing that does not show up as a spell in monthly averages, and the daily highs cited above sit above the monthly averages of their years: $2,918.80 against a January 2026 average of $2,434, and $2,275 against a May 2008 average of $2,052. The full dataset is available as a CSV download.
What this means if you are weighing platinum against gold
Since 1960, platinum’s discount to gold had always been temporary, and this one has now lasted more than eleven years. Every earlier spell ended within two years, mostly through a platinum rally, but the current one has outlasted them all, through a diesel collapse, a pandemic and a record-breaking rally that still left platinum at about half of gold’s price. A wide ratio tells you platinum is cheap relative to gold; it does not tell you when that will change, as our explainer on the gold-silver ratio notes about a similar measure. Platinum’s industrial ties, covered in our look at platinum and palladium demand, are the reason it behaves so differently from gold.
Frequently asked questions
Is platinum cheaper than gold right now?
Yes. In September 2026 platinum averaged $1,784 an ounce and gold $4,319, so an ounce of gold bought about 2.42 ounces of platinum. Platinum has averaged less than gold every month since January 2015.
When was platinum last more expensive than gold?
On monthly averages, December 2014 was the last month platinum cost more than gold. Before that, platinum had been above gold for most of the period since the 1960s.
Has platinum ever been this cheap compared with gold?
Not since at least 1960. In the World Bank’s monthly data, the deepest discount before 2015 was 1.31 ounces of platinum per ounce of gold, in September 1982. Since April 2017 the ratio has stayed above that level, reaching 3.38 in May 2025. The one stretch that compares is the 19th century: USGS annual averages put crude platinum at $1 to $7 an ounce from 1880 to 1897, while gold held at $20.67.