
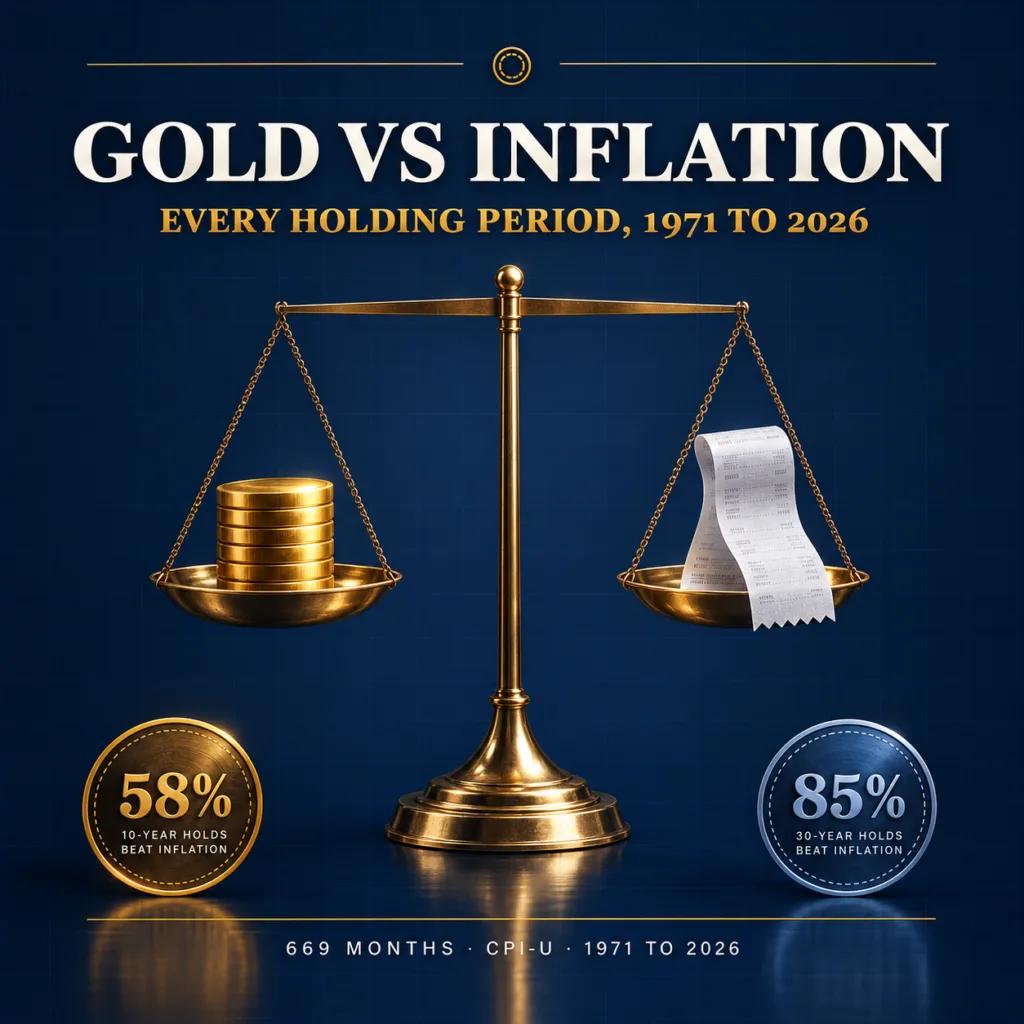
Does gold beat inflation? Over 30 years, usually: in about 85% of periods. Over 1 to 10 years it has been little better than a coin toss, and the answer depended mostly on when you bought. In Bullion Trading LLC research on World Bank monthly gold prices and the BLS consumer price index from January 1971 to September 2026, gold rose faster than consumer prices in 58% of all 10-year holding periods and 85% of 30-year periods. Every 10-year hold that began in the 1980s lost to inflation, and every one that began in the 2000s beat it. In the 11 years since 1971 when inflation ran above 6%, gold beat it in six, all between 1973 and 1980. That fits the conclusion of researchers Claude Erb and Campbell Harvey that “over practical investment horizons, gold is an unreliable inflation hedge“.
| Key finding | Result |
|---|---|
| Months studied | 669, from January 1971 to September 2026 |
| Gold beat inflation over 1 year | 363 of 657 holding periods (55%) |
| Over 5 years | 340 of 609 (56%) |
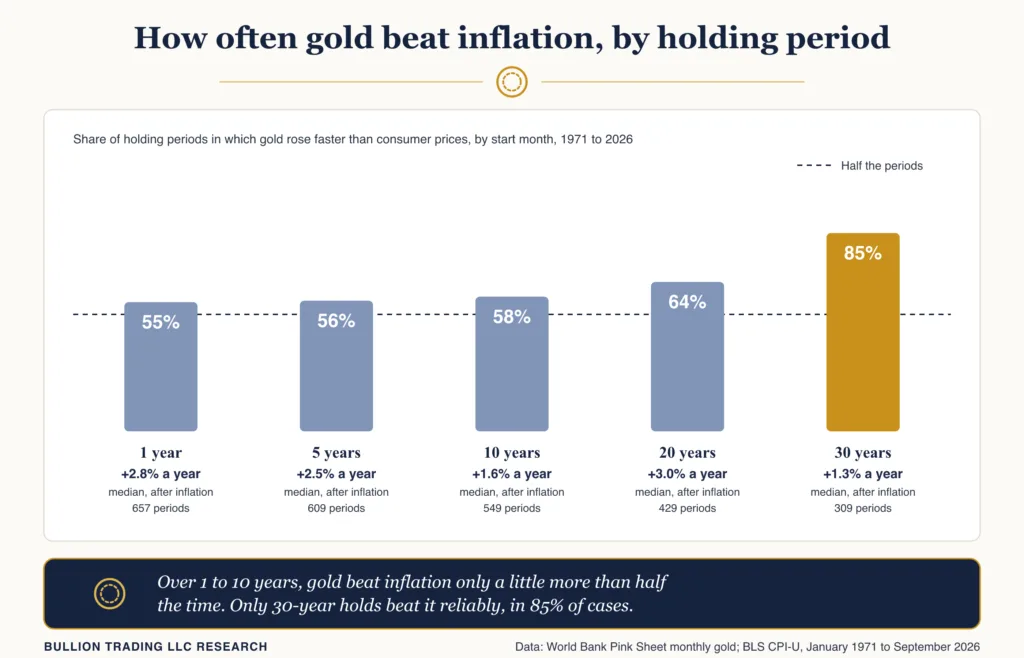
| Over 10 years | 316 of 549 (58%), median 1.6% a year after inflation |
| Over 20 years | 274 of 429 (64%) |
| Over 30 years | 262 of 309 (85%) |
| 10-year holds that began in the 1980s | 0 of 120 beat inflation |
| 10-year holds that began in the 2000s | 120 of 120 beat inflation |
| Years with inflation above 6% | Gold beat it in 6 of 11, all from 1973 to 1980 |
| Longest wait to beat inflation | 45 years: bought January 1980, caught up February 2025 |
| With a 28% tax on gains | 10-year holds that beat inflation fall from 58% to 52% |
Bullion Trading LLC research using World Bank monthly average gold prices and the BLS CPI-U. Method below.
Does gold beat inflation over the long run?
Gold’s record against inflation improves with time, but slowly. Measured from every starting month since January 1971, gold beat consumer prices over the following year 55% of the time, over five years 56%, over 10 years 58% and over 20 years 64%. Only at 30 years did the record turn convincing, with 85% of holds ahead of inflation. The typical margin was modest: the median 10-year hold returned 1.6% a year after inflation.
The full-period number looks better than any of those. From January 1971, when gold averaged $38 an ounce, to September 2026, when it averaged $4,319, gold rose 8.9% a year against inflation of 3.9%, or 4.8% a year in real terms. Much of that came from the 1970s jump after the United States stopped converting foreign governments’ dollars into gold at $35 an ounce in August 1971. Measured from January 1975, the month after Executive Order 11825 revoked the old orders restricting Americans’ gold holdings, the real gain falls to 2.6% a year, and from January 1980 to 0.8%.
Gold versus inflation depends on when you bought
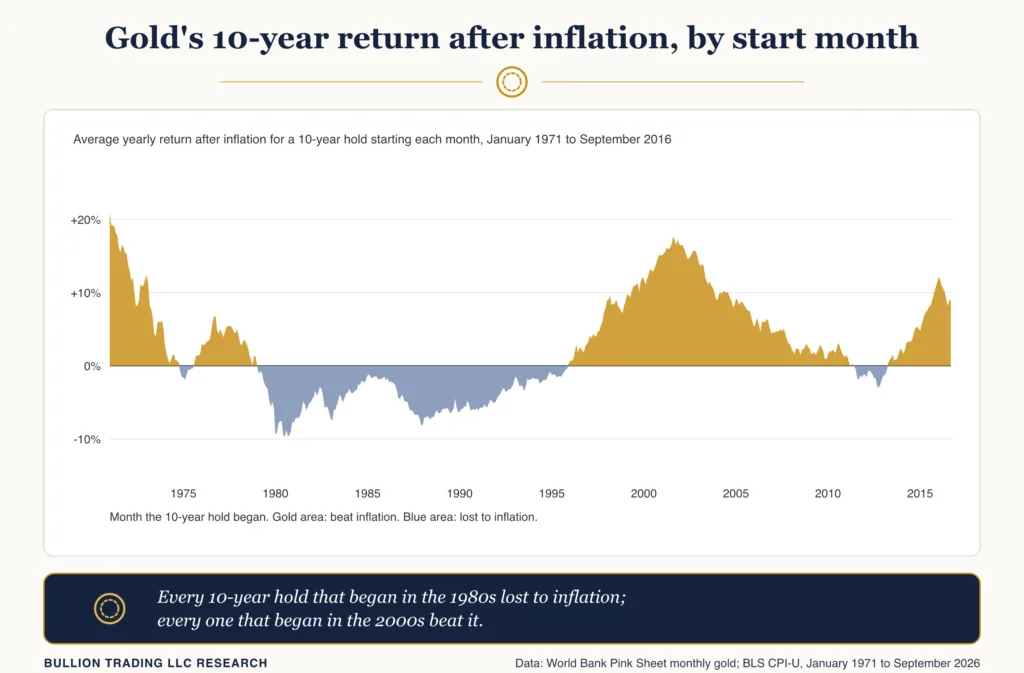
The starting date mattered far more than the length of the hold. Grouping the 10-year holds by the decade they began shows how lopsided the record is.
| 10-year holds starting in | Beat inflation | Median yearly return after inflation |
|---|---|---|
| 1970s (from Jan 1971) | 88 of 108 (81%) | +4.0% |
| 1980s | 0 of 120 (0%) | -5.5% |
| 1990s | 49 of 120 (41%) | -1.5% |
| 2000s | 120 of 120 (100%) | +8.8% |
| 2010s (to Sep 2016) | 59 of 81 (73%) | +1.7% |
Every 10-year holding period starting each month, World Bank monthly average gold prices against the BLS CPI-U. Bullion Trading LLC research.
A buyer at January 1980’s average price of $675 waited 45 years and a month, until February 2025, before gold’s monthly average beat inflation from that starting point, the same long drought our study of gold after record highs found. A buyer in September 2011 waited almost 13 years, until August 2024. The recent past paints the opposite picture: from September 2016 to September 2026 gold returned 8.8% a year after inflation, which makes it easy to forget that the 1980s and 1990s produced long stretches of real losses.
Did gold keep up when inflation spiked?
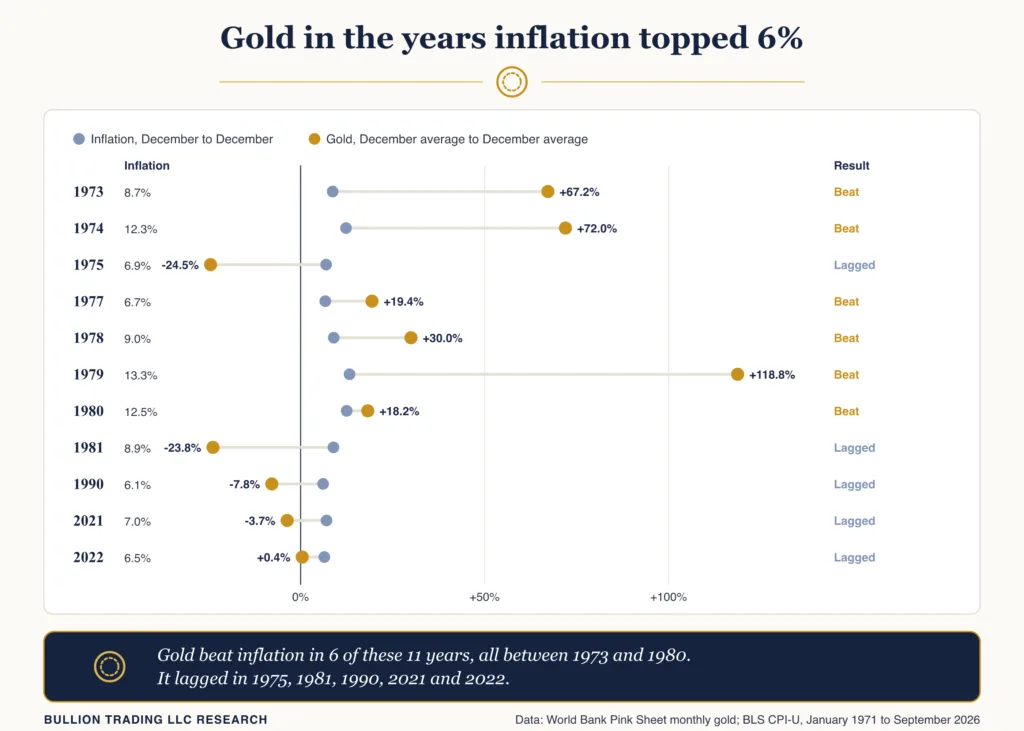
Gold’s reputation as an inflation hedge comes largely from the 1970s. In the 11 calendar years since 1971 when consumer prices rose more than 6% from December to December, gold’s December average beat inflation six times, every one of them between 1973 and 1980, as the 12-month inflation rate climbed to more than 14 percent in 1980. It lagged in 1975, 1981 and 1990, and again in the most recent surge.
In 2021 consumer prices rose 7.0 percent, the largest 12-month increase since 1982, and in 2022 they rose 6.5 percent. Gold’s December average fell 3.7% in 2021 and rose 0.4% in 2022. The World Gold Council blamed rising interest rates and a stronger US dollar in 2021, and in 2022 noted that real yields rose an unprecedented 250 basis points while the dollar gained over 8%, with long-term inflation expectations “conspicuously well anchored“. Our guide to gold and interest rates explains why real rates matter so much.
What other research has found
Researchers reach the same split verdict. In their 2013 paper “The Golden Dilemma”, Erb and Harvey wrote that gold “may be an effective hedge if the investment horizon is measured in centuries”, and that it “may not be a very effective long-term inflation hedge when the long-term is defined as 10 years“. They found rolling 10-year nominal gold returns ranging from about -6% to +20% a year, and trailing 10-year real returns negative from 1988 to 2005. Looking at inflation surprises from 1975 to 2011, they wrote: “There is effectively no correlation here. Any observed positive relationship is driven by a single year, 1980”. A 2012 study by Joscha Beckmann and Robert Czudaj likewise found that gold’s usefulness as an inflation hedge “crucially depends on the time horizon”.
The World Gold Council calls gold “a proven long-term hedge against inflation” whose short-term performance “is less convincing”, and its own figures show that since 1971 “only 16% of the variation in gold prices can be explained by changes in CPI inflation”. In its 2026 strategic asset report, the council found that gold rose 10% a year on average in years when inflation ran between 2% and 5%. Its July 2026 market commentary put the threshold idea plainly: “When inflation is benign, gold doesn’t really pay attention. But above 4%, it starts to feel like a policy mistake“.
A Chicago Fed Letter tied the real gold price to real interest rates and inflation expectations: in annual data for 1971 to 2019, a one-point rise in the long-term real rate went with a 13.1% lower real gold price and, holding that rate fixed, an extra point of ten-year expected inflation with a 37% higher one.
Gold’s real return after taxes
Taxes cut into the margin. The IRS taxes long-term gains on collectibles, including coins, at a maximum 28% rate, and gains on metal held a year or less as ordinary income. A gain is the difference between your cost and the sale price, with no allowance for inflation, so the tax also falls on the part that only kept pace with prices, the point a 1995 St. Louis Fed article made in noting that capital gains are not indexed for inflation. If every gain were taxed at the 28% collectibles rate, the share of 10-year holds that beat inflation would fall from 58% to 52%, and of 30-year holds from 85% to 74%.
The past decade shows the other side. Gold worth $10,000 in September 2016 was worth about $32,547 in September 2026. Even after a 28% tax on the $22,547 gain, the $26,234 left would be well ahead of the $13,956 needed to match inflation. Our guide to the collectibles tax on gold covers how the rate applies.
Bullion Trading research methodology
Gold prices come from the World Bank’s Pink Sheet monthly series, which the monthly workbook linked there describes as a spot average of daily rates from June 2025 and, before that, the average of daily London afternoon fixing prices for 99.5% gold. Inflation is the BLS consumer price index for all urban consumers, not seasonally adjusted (series CUUR0000SA0), the series behind the headline inflation rate. For most CPI series, including this one, October 2025 indexes were not published after the government shutdown, so we used the average of September and November. A holding period beats inflation when gold’s monthly average rose by a larger factor than the index; we start one period every month from January 1971 and report the median yearly return after inflation. Calendar years compare December averages.
Because overlapping periods share most of their months, the 549 ten-year results are far from independent, so we report shares and medians rather than p-values. Starting in January 1975 instead of 1971, after the ownership orders were revoked, gold beat inflation in 53%, 52%, 54%, 63% and 90% of 1-, 5-, 10-, 20- and 30-year holds, so the pattern holds. Silver did worse, beating inflation in 43% of 10-year holds. The full dataset is available as a CSV download.
What this means if you are buying gold for inflation
The record supports gold as a very long-run store of purchasing power, not as a dependable shield over the next year or the next decade. Over 30 years it beat inflation in most periods; over 10 years it did so a little more than half the time, and the decade you started in decided most of the outcome. That’s one reason many holders treat gold as a share of a portfolio rather than a bet on the next inflation report, an approach our piece on how much gold and silver to own covers. In true currency collapses the picture is different, as our look at hyperinflation and gold shows.
Frequently asked questions
Is gold a good hedge against inflation?
Over very long periods, usually; over shorter ones, unreliably. In Bullion Trading LLC research covering 1971 to 2026, gold beat inflation in 85% of 30-year holding periods but 58% of 10-year periods.
Did gold keep up with inflation in 2022?
No. Consumer prices rose 6.5% in 2022, while gold’s December average rose 0.4%. In 2021 inflation was 7.0% and gold’s December average fell 3.7%.
How long has gold taken to catch up with inflation?
From January 1980’s monthly average, 45 years: gold’s monthly average did not beat inflation from that starting point until February 2025. From September 2011, it took until August 2024.