
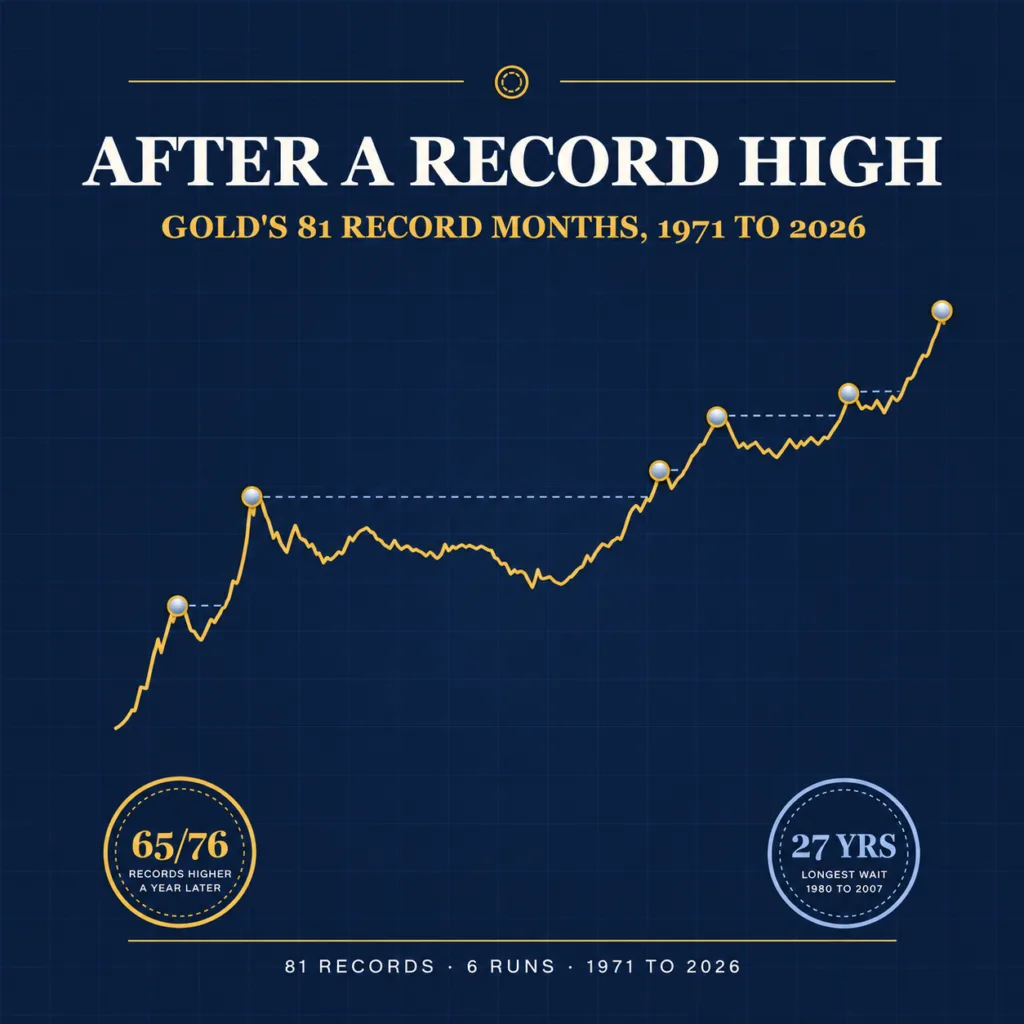
After most of its record highs, gold kept climbing. The worst damage came after the record that turned out to be the last of its run. Bullion Trading LLC research tracked gold after record highs using World Bank monthly prices from January 1971 to September 2026: gold set 81 record months, months whose average price beat every month before them. A year later it was higher after 65 of the 76 records with a full year of data, about 86%, against 61% for all months. But the records came in six runs, and after the last record of each completed run gold fell 15% to 62% and took between a year and a half and more than 27 years to set another. The World Gold Council, counting on daily prices, finds eight drops of more than 20% after a record high since 1971, with a median fall of 29%.
| Key finding | Result |
|---|---|
| Months studied | 669, from January 1971 to September 2026 |
| Record months | 81, in six runs: 1972 to 1974, 1978 to 1980, 2007 to 2008, 2009 to 2011, 2020, and 2023 to 2026 |
| Gold higher a year after a record month | 65 of 76 (86%), median gain 32% |
| Gold higher a year after any month | 404 of 657 (61%), median gain 6% |
| Gold higher three years after a record month | 41 of 59 (69%), against 66% for any month |
| Records followed by a lower price a year later | 11, all among the last four records of their run |
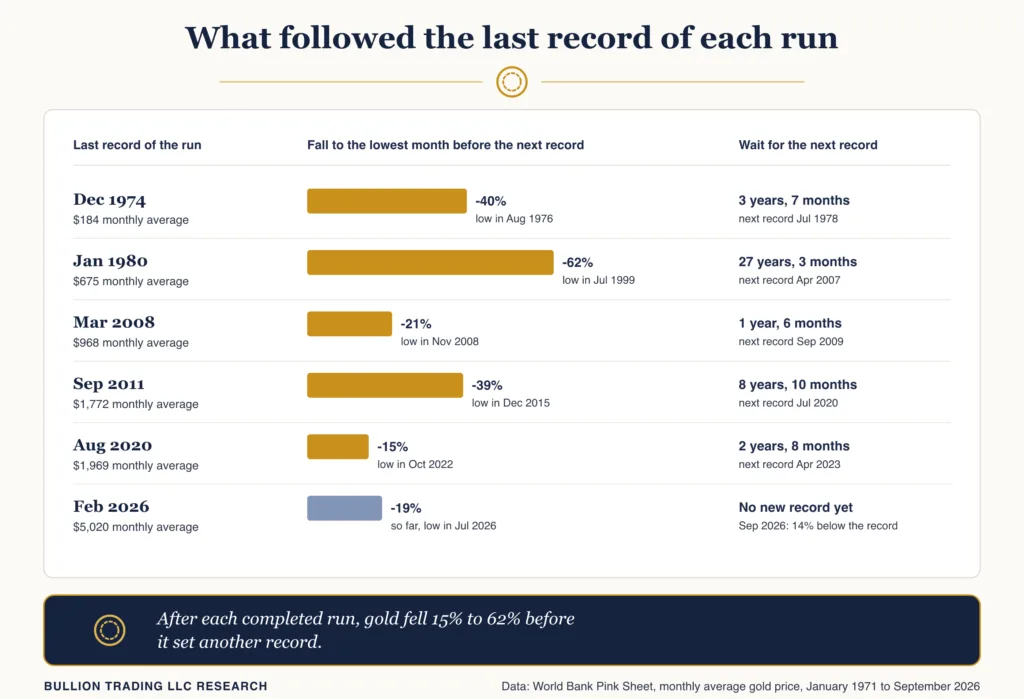
| Fall after the last record of a completed run | 15% to 62%, on monthly averages |
| Longest wait for a new record | 27 years and 3 months, from January 1980 to April 2007 |
| January 1980 record after inflation | Passed in February 2025 on monthly averages |
| World Gold Council benchmark (daily prices) | 8 drops of more than 20% after a record since 1971; median 29%, average 36% |
| Where 2026 stands | Highest monthly average February 2026 ($5,020); September 2026 was 14% below it |
Bullion Trading LLC research using World Bank monthly average gold prices and BLS consumer prices. Method below.
What happened to gold after an all-time high
A record month was usually followed by more gains. One month after a record, gold’s monthly average was higher 72% of the time, against 50% for all months, though part of that short-term edge comes from averaging itself: when prices climb through a record month, the next month starts from the higher level. A year out, gold was higher after 86% of record months, with a median gain of 32%, against 61% and 6% for any month. Records arrive in rising markets, and rising gold markets have tended to keep going for a while, so this mostly measures momentum inside bull runs.
A market research firm reached a similar answer with different data. SentimenTrader studied bursts of record closes in gold futures and found, in what it called a small sample, that gold was “higher 80% of the time” a year later, with a median gain of 33.4%, even though the month right after usually brought a loss.
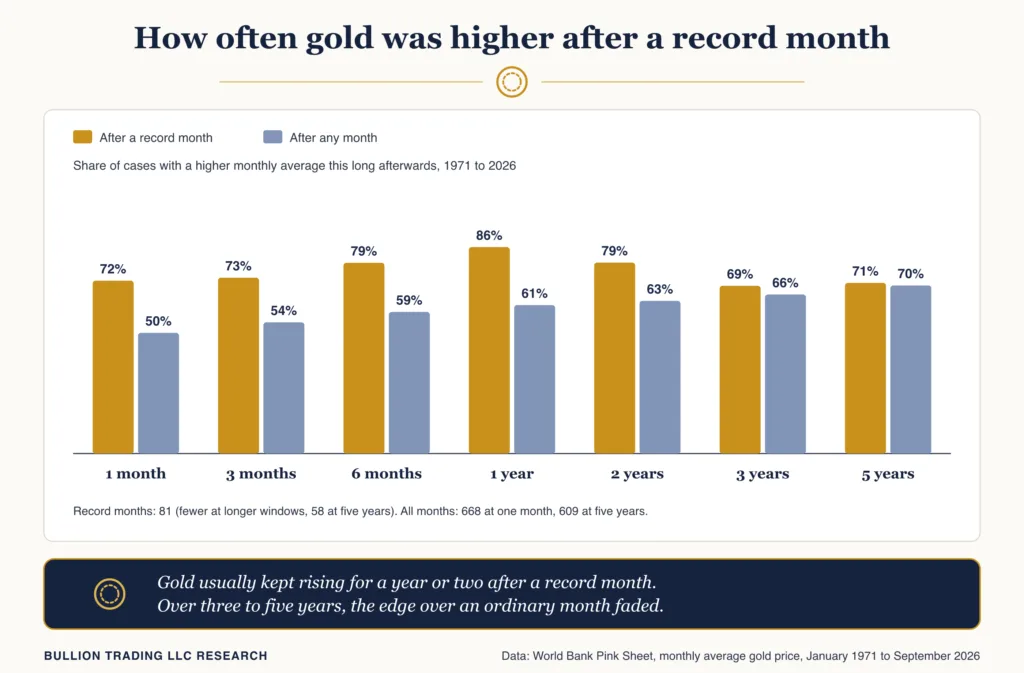
The edge faded with time. Three years after a record month, gold was higher 69% of the time, barely above the 66% for any month, and at five years the two were level at about 70%. Over those longer spans a record month was about as likely as any other to end higher, though the median gain after records stayed larger (at five years, average gains were about equal).
Gold’s record highs come in runs
Gold’s records arrive in clusters. Of the 81 record months, 58 were followed immediately by another record, and the median wait from one record to the next was a single month. Splitting the 81 records wherever more than a year passed without one gives six runs, listed below.
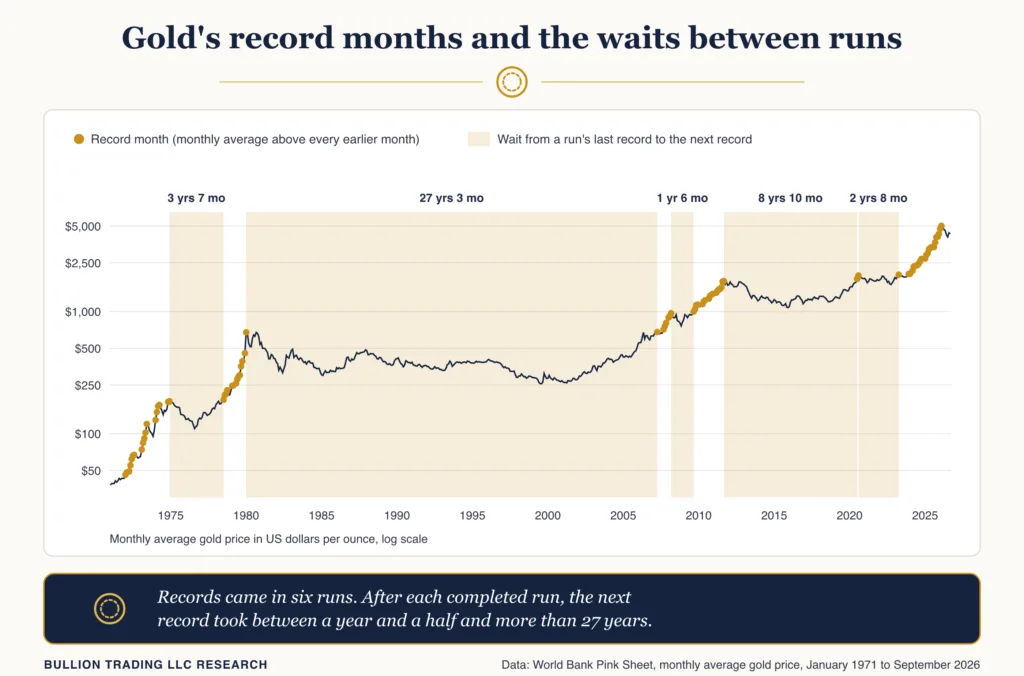
Between the runs came long droughts. The 1970s produced 30 record months, the 1980s one (January 1980) and the 1990s none. The current run, with 23 record months, is the largest of the six. On daily prices, the World Gold Council counted 40 record highs in 2024, 53 in 2025 and 12 in January 2026 by that month’s count, all on the LBMA afternoon price. On our monthly averages, 2024 brought eight record months and 2025 brought 11.
Every run of record highs since 1971
Here are all six runs, from first record to last, and what followed each.
| Run | Record months | Peak monthly average | 12 months after first record | Fall after last record (lowest month) | Wait for next record |
|---|---|---|---|---|---|
| Jan 1972 to Dec 1974 | 18 | $184 | +41% | -40% (Aug 1976) | 3 years, 7 months |
| Jul 1978 to Jan 1980 | 13 | $675 | +56% | -62% (Jul 1999) | 27 years, 3 months |
| Apr 2007 to Mar 2008 | 7 | $968 | +34% | -21% (Nov 2008) | 1 year, 6 months |
| Sep 2009 to Sep 2011 | 18 | $1,772 | +27% | -39% (Dec 2015) | 8 years, 10 months |
| Jul 2020 to Aug 2020 | 2 | $1,969 | -2% | -15% (Oct 2022) | 2 years, 8 months |
| Apr 2023 to Feb 2026 | 23 | $5,020 | +17% | -19% so far (Jul 2026) | None yet as of Sep 2026 |
Monthly average gold price, World Bank Pink Sheet, January 1971 to September 2026. A new run starts when a record comes more than 12 months after the previous one. Bullion Trading LLC research.
When the record high was the top
Only 11 of the 76 record months were followed by a lower price a year later, and every one sat among the last four records of its run: April, November and December 1974; January 1980; November 2007, January and March 2008; August and September 2011; and July and August 2020. When the World Gold Council tested whether past price patterns resembling the current one could forecast gold’s next move, it found the signal “little better than a coin toss“.
January 1980 was the costliest top. After the crises in Iran and Afghanistan, investors appeared to move out of dollar assets and into precious metals. Gold closed at $850 in London on January 21, 1980, and two mornings later it “crashed” to $650, economist Steven Plaut wrote that May in the Cleveland Fed’s Economic Commentary. The Federal Reserve’s tougher anti-inflation measures, announced in October 1979, pressed on: the federal funds rate reached 20% in late 1980, and a 1982 Christian Science Monitor report, looking back at gold’s slide since early 1980, put the cause “in two words: interest rates”. Our guide to gold and interest rates covers that period. Spot gold did not break $850 again until January 2, 2008, according to a Reuters timeline.
The September 2011 top unwound in stages. The London afternoon fix peaked at $1,895 that month, and the slide gathered speed in 2013, when gold suffered its biggest one-day drop in 30 years in April. After Ben Bernanke laid out how the Fed would roll back its bond purchases, gold headed for its biggest quarterly loss in Reuters data going back to 1968.
How our numbers compare with the World Gold Council’s
The World Gold Council measured the same risk with daily prices. In its Gold Mid-Year Outlook 2026, it found eight episodes since 1971 in which gold dropped by more than 20% after reaching a record high, “with an average drawdown of 36% and a median of 29%”, measured from gold’s running peak and leaving out the decline that began on January 29, 2026. The deepest, in 1980, was more than 65%.
Top for top, daily falls are likely deeper, because daily prices catch peaks and troughs that monthly averages smooth away: the council puts 1980 at more than 65%, against our 62%. Its median of 29% is lower than the 39% median of our five completed runs, though, probably because it counts every drop of more than 20% from a running peak, including dips inside a run, while our table tracks only the fall after each run’s last record. The averages match, at about 36%.
Gold’s record highs after inflation
Adjusted for US consumer prices, gold’s January 1980 monthly average of $675 equals about $2,910 in September 2026 dollars, and it stood as the inflation-adjusted record for 45 years. Gold’s monthly average first passed it in February 2025. Measured from the $850 daily peak instead, Bloomberg calculated that gold eclipsed its inflation-adjusted 1980 high in September 2025, when $850 equated to about $3,590, as Argaam reported. Gold set only 32 record months in real terms over the whole period, against 81 in dollars. In a 2013 paper, researchers Claude Erb and Campbell Harvey found that when gold’s real price was above average, later real returns were below average, “consistent with mean reversion”.
Where 2026 stands
On daily prices, gold’s latest run peaked in late January 2026. The LBMA afternoon price reached $5,405.00 on January 29, and the next day, after President Trump selected Kevin Warsh to succeed Jerome Powell as Federal Reserve chair, gold’s settlement price fell 11.4% to $4,745.10, the Associated Press reported, while spot gold was down 8.5% late in the day, according to The National. On monthly averages, February’s $5,020 was the highest of any month, above January’s $4,753. By July the average was $4,073, 19% below February, and in September it was $4,319, still 14% under. On daily prices the fall is deeper, about 25% by late June by the council’s calculation, and its September 2026 commentary still lists $5,405 as the record.
That would already qualify as a drop of more than 20% on the council’s measure, though the council left it out of its count, and it sits inside the range of past falls, which says nothing about whether the late-January peak was the top. Our look at the 2026 gold and silver correction covers what drove the drop, and our report on the $5,000 record covers the rally before it.
Bullion Trading research methodology
Prices come from the World Bank’s Pink Sheet monthly gold series, which the monthly workbook linked there describes as a spot average of daily rates from June 2025 and, before that, the average of daily London afternoon fixing prices for 99.5% gold. The study covers every month from January 1971 to September 2026, 669 in all. A record month is one whose average beat every earlier monthly average back to January 1960, so the first came in January 1972, when gold averaged $46 and passed the $43 it had reached in 1969. For each month we measured the change in the monthly average 1, 3, 6, 12, 24, 36 and 60 months later.
Monthly averages smooth out single days, so our record months do not match the daily records in the news. January 1980 averaged $675 against an $850 peak. For inflation we used the BLS consumer price index for all urban consumers, seasonally adjusted (series CUSR0000SA0); BLS published no October 2025 figure, so we used the average of September and November. Whole-dollar rounding makes early-1970s moves approximate.
Because records cluster, their one-year windows overlap, so we did not attach a p-value. We tested our choices instead. Against non-record months only, the one-year gap widens to 86% versus 58%; counting only records at least a year apart, 11 of 13 were higher a year later; since 2000 the gap narrows to 84% versus 73%. The five newest records lack a full year, so the one-year share will end between 80% and 86%. The last-four-records finding holds with a 6- or 12-month gap between runs, not with 24 months. Ties don’t count: May 2006 matched January 1980’s $675 without beating it. The full dataset is available as a CSV download.
What this means if you are buying at a record high
History does not say a record high is a bad time to buy gold. Most record months were followed by higher prices a year later, and over three to five years, a record month was about as likely as any other to end higher. The biggest risk sits at the end of each run: falls of 15% to 62% on monthly averages and waits of a year and a half to more than 27 years for a new record. Smaller dips came inside runs too, such as a 21% drop in 1973. Since there has been no reliable way to tell in advance which record is the last, many buyers spread purchases over time, an approach our guide to dollar-cost averaging into gold and silver explains.
Frequently asked questions
Is it a bad idea to buy gold at an all-time high?
Not on the record. In Bullion Trading LLC research covering 1971 to 2026, gold was higher a year after 65 of 76 record months. The losses came after the last records of each run, which were hard to spot at the time.
How long did gold take to recover after the 1980 peak?
On monthly averages, gold did not beat January 1980’s $675 until April 2007, 27 years and 3 months later. Adjusted for inflation, it took until February 2025.
How far has gold fallen after a record high?
After the last record of each completed run, gold’s monthly average fell 15% (2020 to 2022) to 62% (1980 to 1999).