
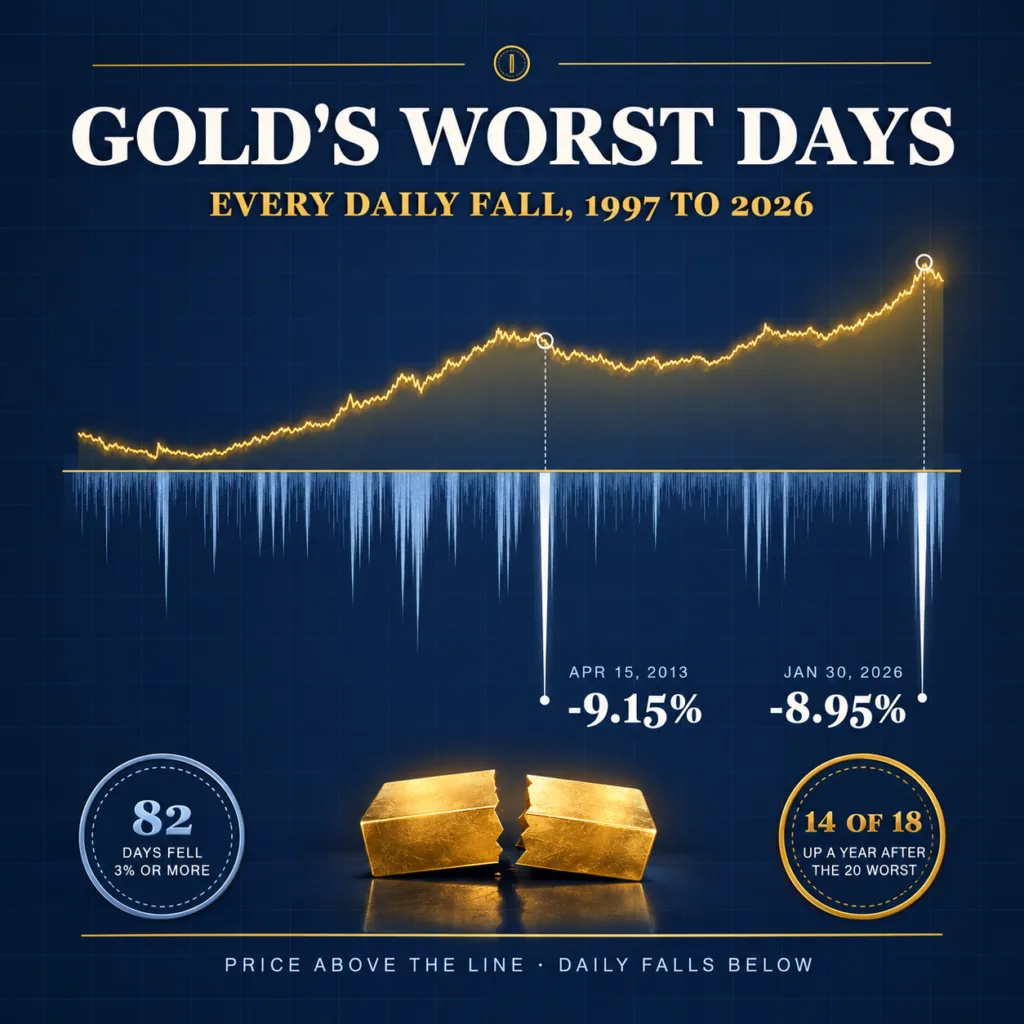
| Key finding | Result |
|---|---|
| Daily moves studied | 7,715, January 2, 1997 to October 27, 2026 |
| Biggest one-day fall | April 15, 2013: -9.15%, $1,535.50 to $1,395.00 |
| Second biggest | January 30, 2026: -8.95%, $5,375.24 to $4,894.23, the biggest in dollars ($481.01) |
| On spot and futures | January 30, 2026 fell further; COMEX futures settled 11.4% lower |
| London afternoon fix, 1968 to 2021 | January 22, 1980 (-13.24%), February 28, 1983 (-12.10%), April 15, 2013 (-9.15%) |
| Falls of 3% or more | 82 days; 18 in 2008 and 12 in 2026 through October 27 |
| Near a record | 5 of the 20 biggest falls, with the price the day before within 1.1% of a record high |
| A year after the 20 biggest falls | Higher in 14 of 18 (78%), median +6.4%; after any day, 69% and +8.6% |
| Back to the pre-crash price | After 19 of 20, median wait 34 days; April 2013 took until August 28, 2019 |
Bullion Trading LLC research using the daily London gold price of the Banco Central de Reserva del Perú (source: Reuters) and, for 1968 to 2021, the London afternoon fix. Method below.
Gold’s biggest one-day crashes since 1997: the top 20
Gold’s 20 biggest one-day falls since January 1997 range from 4.54% to 9.15%, and seven came in 2008. The median daily move, up or down, was 0.52%, and on three days in four the price moved less than 1%. Only 16 of the 7,715 daily changes were falls of 5% or more, against 10 rises that size, so gold’s worst days have been bigger and more frequent than its best.
| Rank | Date | From | To | Fall | A month later | A year later |
|---|---|---|---|---|---|---|
| 1 | April 15, 2013 | $1,535.50 | $1,395.00 | -9.15% | +1.1% | -7.0% |
| 2 | Jan. 30, 2026 | $5,375.24 | $4,894.23 | -8.95% | +7.9% | not yet |
| 3 | Oct. 13, 2008 | $892.10 | $831.20 | -6.83% | -13.5% | +27.2% |
| 4 | March 19, 2008 | $1,005.00 | $944.00 | -6.07% | -3.1% | +1.3% |
| 5 | Feb. 8, 2000 | $315.30 | $296.50 | -5.96% | -1.6% | -11.3% |
| 6 | Oct. 16, 2008 | $847.90 | $798.10 | -5.87% | -10.1% | +32.3% |
| 7 | June 20, 2013 | $1,372.75 | $1,292.50 | -5.85% | +0.3% | +1.5% |
| 8 | Aug. 24, 2011 | $1,886.08 | $1,778.71 | -5.69% | -5.7% | -6.1% |
| 9 | April 1, 2008 | $932.80 | $880.00 | -5.66% | -3.4% | +5.0% |
| 10 | June 13, 2006 | $609.70 | $577.00 | -5.36% | +12.0% | +13.0% |
| 11 | Oct. 21, 2025 | $4,356.30 | $4,125.22 | -5.30% | -1.5% | +0.4% |
| 12 | Dec. 14, 2011 | $1,660.26 | $1,572.96 | -5.26% | +3.9% | +7.9% |
| 13 | May 19, 2006 | $691.10 | $654.90 | -5.24% | -12.2% | +1.2% |
| 14 | Aug. 11, 2020 | $2,044.50 | $1,939.65 | -5.13% | +0.4% | -10.1% |
| 15 | Oct. 2, 2008 | $879.10 | $834.50 | -5.07% | -12.5% | +20.1% |
| 16 | March 12, 2020 | $1,653.75 | $1,570.70 | -5.02% | +7.0% | +8.5% |
| 17 | March 16, 2020 | $1,562.80 | $1,487.70 | -4.81% | +16.3% | +16.6% |
| 18 | Dec. 1, 2008 | $813.90 | $774.90 | -4.79% | +11.6% | +54.5% |
| 19 | Feb. 2, 2026 | $4,894.23 | $4,661.38 | -4.76% | +14.2% | not yet |
| 20 | Aug. 15, 2008 | $817.10 | $780.00 | -4.54% | -0.3% | +22.2% |
Gold’s 20 biggest one-day falls in the daily London price, January 1997 to October 2026, and the change from the crash-day price a month and a year later. Bullion Trading LLC research; data: Banco Central de Reserva del Perú (Reuters).
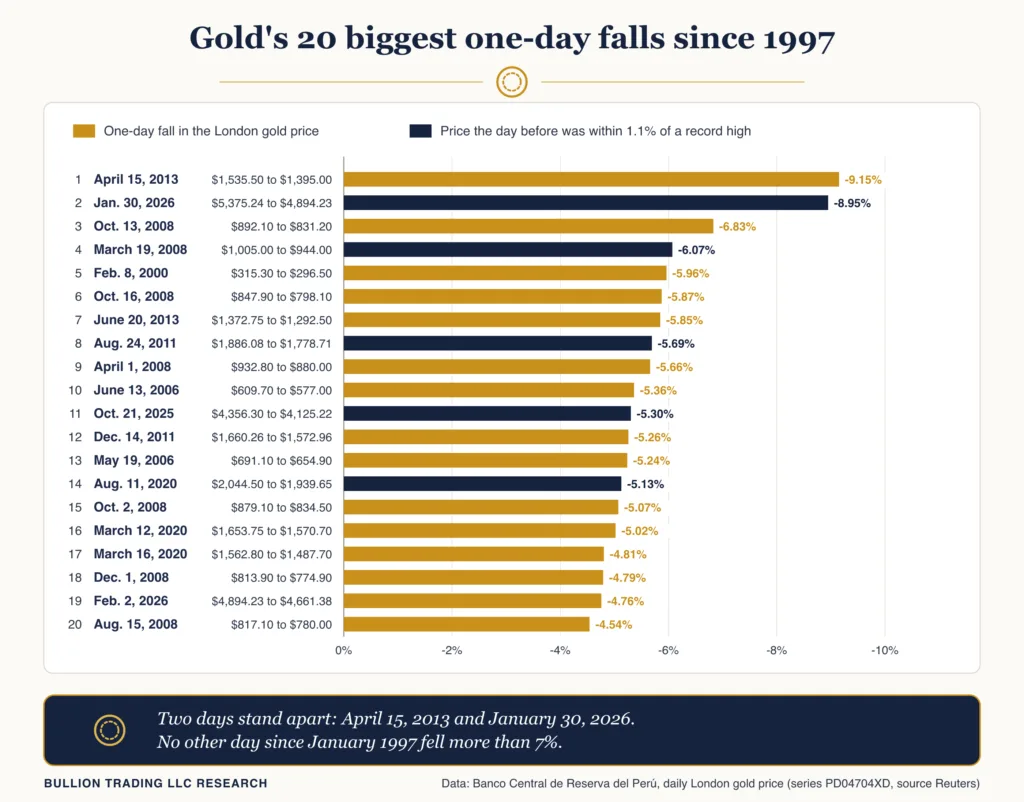
Ranked in dollars, 16 of the 20 largest falls came in 2026, three in 2025 and one in 2013, since a percentage costs more at $5,000 an ounce than at $300. The $481.01 lost on January 30, 2026 was more than three times the $140.50 of April 15, 2013.
April 15, 2013 and January 30, 2026: gold’s worst days since 1983
The April 2013 crash built over days. News that Cyprus’s central bank might sell gold for its bailout “did trigger a rush for the exits”, Reuters wrote, and signs that the Fed was nearing a decision to slow its bond buying added pressure. Late on Monday, April 15, spot gold was down 8.9%, “its biggest single percentage fall since 1983“, and the London afternoon fix went from $1,535.50 to $1,395.00. In China, buyers lined up to buy, as our post on the Chinese dama tells. The price did not get back to $1,535.50 until August 28, 2019.
The January 2026 crash came a day after spot gold hit a record $5,594.82 in Reuters’ data. On January 30, gold “was headed for its steepest daily fall since 1983 after U.S. President Donald Trump announced his choice for Fed chair“, Kevin Warsh, and February futures settled 11.4% lower at $4,745.10. CME then raised margins on COMEX gold futures from 6% to 8% of contract value, effective after the close on February 2, and the London price fell another 4.76% that Monday. The two days together fell 13.28%, the biggest two-day fall in our data.
Which crash was bigger depends on the price you measure. Our series uses the London afternoon fix in 2013 and what looks like a spot quote in 2026, and on it April 2013 comes first. On Reuters’ spot price, 2013 fell 8.9% and 2026 “more than nine per cent“; on COMEX futures, 2013 fell “$140.30, or 9 percent” and 2026 fell 11.4%. Timing matters too. A daily price taken during the London day books late New York selling on the next day: on October 13, 2008, when our series falls 6.83%, gold in New York fell 1.9 percent, to $842.50 for December futures. Those futures had settled at $859.00 the Friday before, already 4.6% below that afternoon’s London fix of $900.50.
Gold’s crashes come in clusters, often near a record
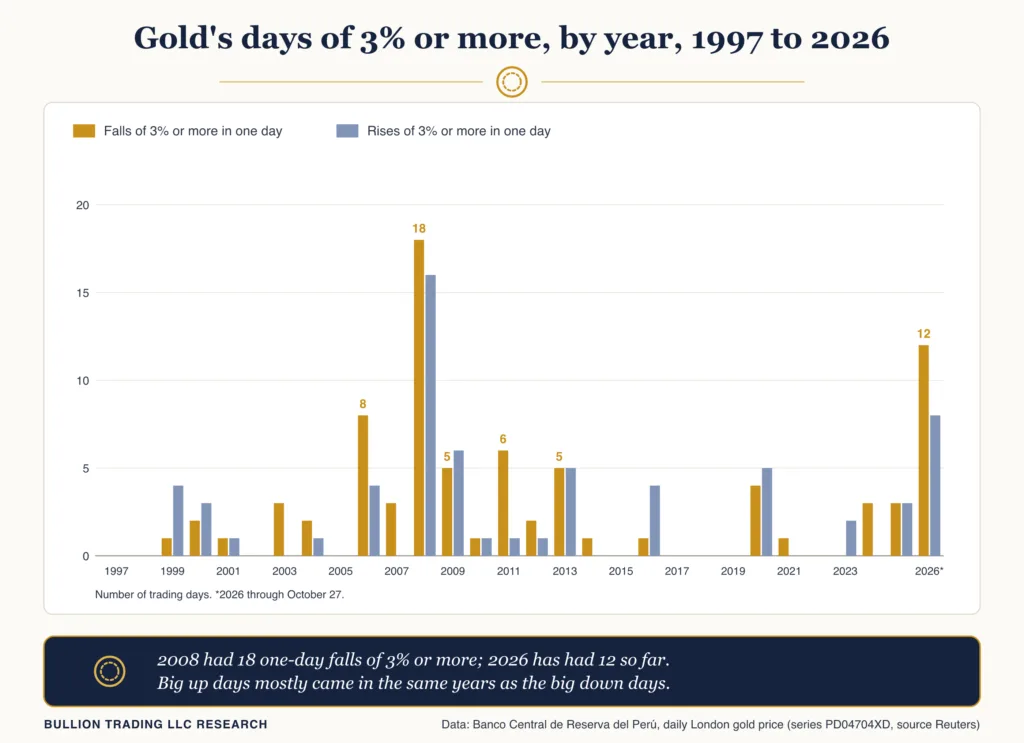
Gold’s big one-day falls arrive in bunches. In 2008 the London price fell 3% or more on 18 days and rose that much on 16. In 2026, through October 27, it has fallen 3% or more on 12 days, the most since 2008, and risen that much on 8. Ten of the 30 years had no such fall. In March 2020, “traders sold bullion to finance margin calls in other assets“. The day after the February 2, 2026 fall, gold rose 6.12%, its biggest gain of the year.
Five of the 20 biggest falls came when the price the day before was within 1.1% of a record high. March 19, 2008 followed the Engelhard price’s all-time high of “$1,013.62 per troy ounce on March 17” and a Fed rate cut smaller than analysts had forecast. August 24, 2011 followed gold’s “first ever foray above record $1,900“, and CME then raised margins on gold futures by about 27 per cent. August 11, 2020, October 21, 2025 and January 30, 2026 complete the list. Our study of gold after record highs found that runs of record months ended with falls of 15% to 62% in monthly averages.
Before 1997: the crashes of 1980 and 1983
Gold’s two biggest one-day falls on the London afternoon fix came in the early 1980s. On January 21, 1980, the fix reached $850 an ounce, the price the Bureau of Mines called “an historic high“, and the next afternoon it was fixed at $737.50, down 13.24%. On the morning of January 23, gold “crashed” to $650, the Cleveland Fed wrote. Silver collapsed that spring too, as our Hunt brothers post tells. On February 28, 1983, the fix fell 12.10%, from $464.75 to $408.50, after a run “from $300 per troy ounce last June to $520 an ounce in February“. The fix did not regain $850 until January 3, 2008. The October 1987 stock crash left gold about where it started: the fix rose 3.39% on October 19 and gave it back the next day.
What gold did after its biggest one-day falls
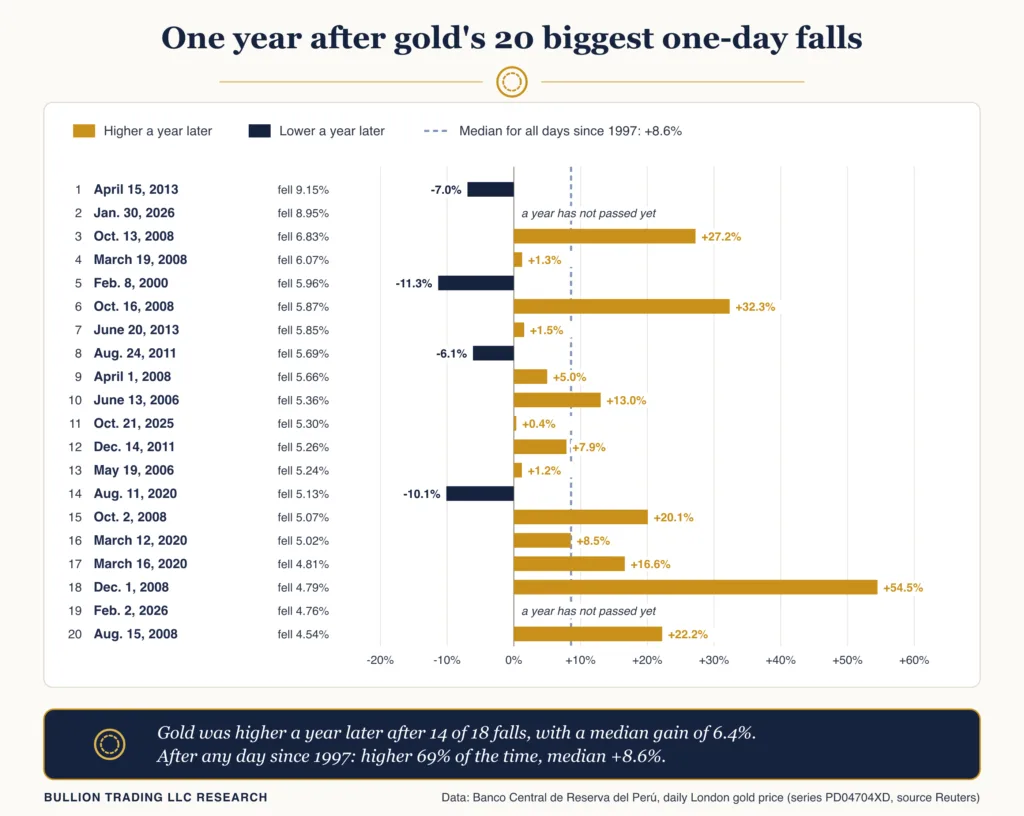
A big one-day fall told you little about where gold would be a year later. After the 20 biggest falls since 1997, gold was higher a year later in 14 of the 18 cases with a full year of data (78%), with a median gain of 6.4%. After any day in the same years, it was higher 69% of the time, with a median gain of 8.6%. The month after a crash was a coin toss: higher in 10 of 20 cases, against 54% for all days.
The result depends on how you count. Measured 252 trading days ahead instead of a calendar year, gold was higher after 12 of the 18 falls. Counting only the first fall in each cluster (13 episodes with a year of data), it was higher after 9, with a median gain of 1.3%. Across all 82 falls of 3% or more it was higher a year later in 54 of 69 cases (78%), but 18 of those falls came in 2008, before gold’s 2009 rally.
Most falls were won back quickly. Gold got back to its pre-crash price after 19 of the 20, with a median wait of 34 days. Four took more than a year: March 2008 (about 18 months), February 2000 (over two years), August 2020 (over two and a half) and April 2013 (over six). Dow Jones Market Data found that after futures falls of 5% or more since May 24, 2006, gold “on average traded about 1.82% higher a month later“; in our London price, the 13 falls of 5% or more from that date to October 2025 averaged -1.9%.
Bullion Trading research methodology
The price series is the Banco Central de Reserva del Perú’s daily “Oro (Londres, US$ por onzas troy)”, series PD04704XD, listed with “Fuente: Reuters“: 7,716 prices from January 2, 1997 to October 27, 2026. A one-day fall is the change from one published price to the next, so a Monday is compared with the Friday before. “A month later” and “a year later” use the last price on or before the same date one month or one year on, and the all-days comparison starts from every price with a full window ahead (7,455 for a year). “Back to the pre-crash price” is the first day at or above the price the day before the fall.
The bank does not say which price it records, so we compared it day by day with the London fixing prices that the St. Louis Fed’s FRED carried until 2021. It equals the afternoon fix on most days from July 2001 to November 2003 and from late March 2013 to March 2021. In between, and before July 2001, it matches neither fix, though its daily changes track the afternoon fix closely. Since 2023 its prices end in any cent, like a spot quote, and on many London holidays it repeats the last price. On the afternoon fix alone, the biggest falls from 1997 to 2021 were April 15, 2013 (-9.15%), October 13, 2008 (-7.66%) and May 19, 2006 (-6.06%). The 1968 to 2021 ranking uses 13,309 daily changes in that fix.
Records include the London price of $850 on January 21, 1980, so no fall before 2008 counts as near a record. We computed from unrounded prices and rounded half up; March 19, 2008’s year-later gain is exactly 1.25%, shown as 1.3%. Falls 30 days or less apart count as one episode, and twenty falls in 14 episodes are a small sample. The dataset, one row for each of the 82 falls of 3% or more, is available as a CSV download; the full daily series is on the bank’s site.
Frequently asked questions
What was gold’s biggest one-day drop?
On the London afternoon fix from 1968 to 2021, it was January 22, 1980: -13.24%, from $850 to $737.50. Since 1997, the biggest falls were April 15, 2013 (-9.15% in the London price we studied) and January 30, 2026, the steeper of the two on spot and on COMEX futures (-11.4%).
How much did gold fall on January 30, 2026?
The London price we studied fell 8.95%, from $5,375.24 to $4,894.23, the biggest dollar drop in our data ($481.01). Futures settled 11.4% lower at $4,745.10 after President Trump named Kevin Warsh to lead the Fed. As of October 27, 2026, gold had not regained its January 29 price.
Does gold recover after a crash?
Usually, though not always quickly. After 19 of its 20 biggest one-day falls since 1997, gold got back to its pre-crash price, with a median wait of 34 days. The April 2013 fall took more than six years to win back. A year after the 20 biggest falls, gold was higher in 14 of 18 cases, a little more often than after any day (69%).