
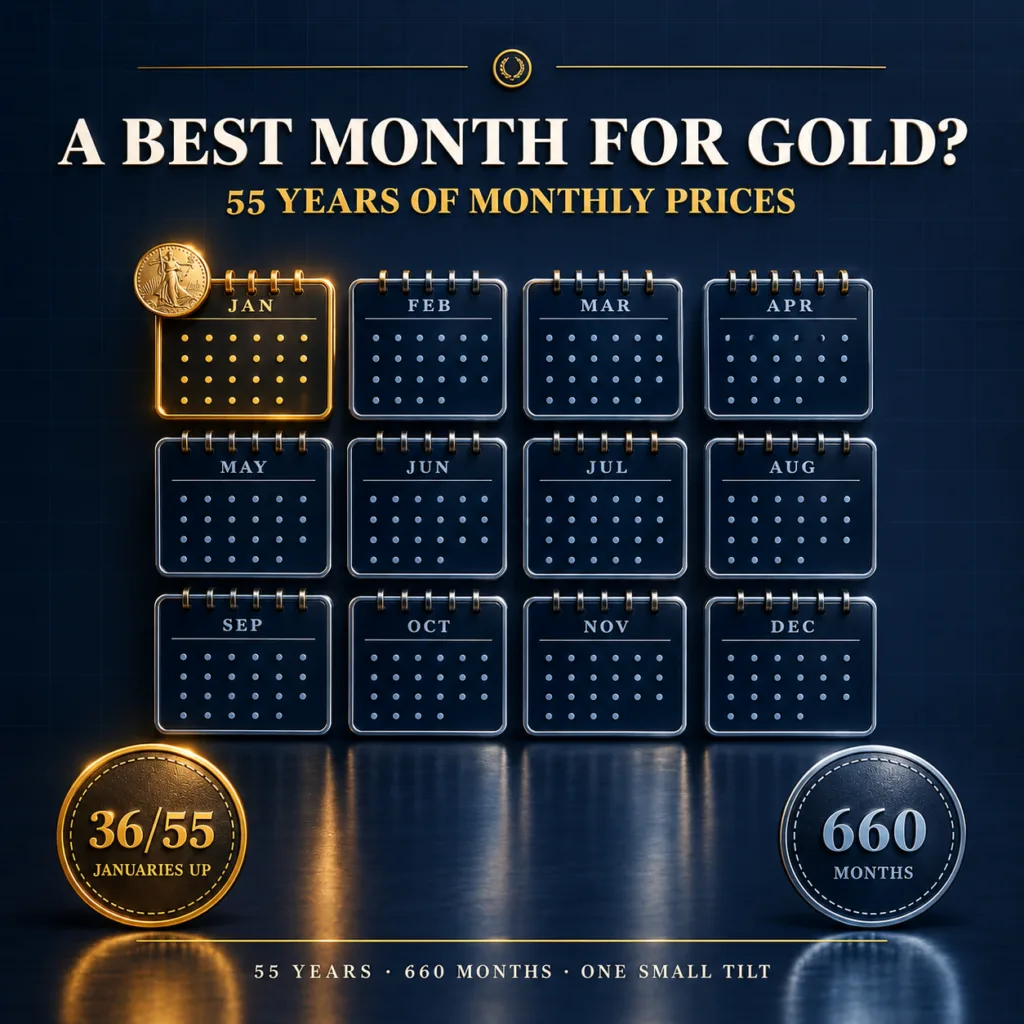
There is no best month to buy gold that reliably beats the others, but there is a small tilt. In Bullion Trading LLC research covering 55 years of World Bank monthly gold prices, from 1971 to 2025, January was the month gold rose most often: in 36 of 55 years, about 65%, with a median gain of 1.6%. April and May were the weakest months, the only two with a median decline. With gold’s long-term uptrend removed, prices sat lowest relative to trend in July, September and December, by a little over 1%. Across all 12 months, though, the differences are not statistically significant, and gold typically moves more than 2% in a single month. The World Gold Council and recent academic work reach a similar answer: a January effect that shows up in the averages (in the academic work, only since 2010) and is far from guaranteed.
| Key finding | Result |
|---|---|
| Months studied | 660, covering 55 years from 1971 to 2025 |
| Month gold rose most often | January: 36 of 55 years (65%), median +1.6% |
| January in the last 28 years | Rose in 21 of 28 (75%) |
| Weakest months | April and May, the only months with a median decline (-0.6% and -0.3%); May rose in just 22 of 55 years |
| Lowest relative to trend | July, September and December, 1.3% to 1.4% below trend (median) |
| Highest relative to trend | February and May, about 0.5% above trend (median), with April close behind |
| Do the 12 months really differ? | Not statistically significant (Kruskal-Wallis test, p = 0.54) |
| January’s record on its own | Unusual for one month tested alone (p = 0.03), but not after allowing for all 12 months tested (p = 0.36) |
| Typical size of a monthly move | 2.3% up or down (median absolute change) |
Bullion Trading LLC research using World Bank monthly average gold prices. Method below.
Is there a best month to buy gold?
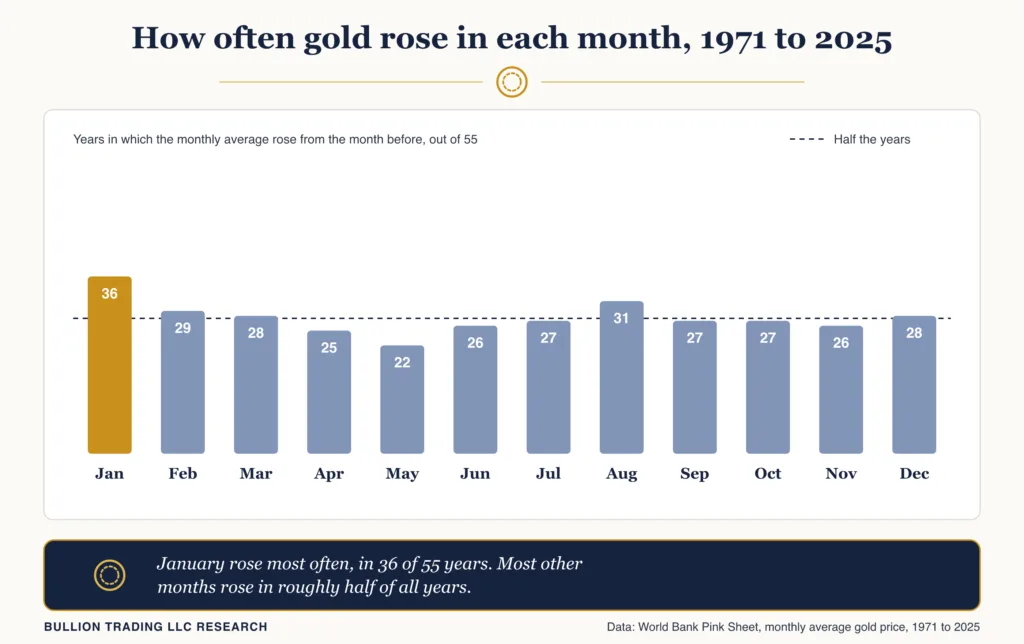
January stands out as the month when gold most often went up, and no other month stands out by much. Comparing each month’s average price with the month before, gold rose in 36 of 55 Januaries. August came second at 31. Most months landed close to a coin flip, and May was the weakest, with gold higher in only 22 of 55 years. The January record has been stronger lately: gold rose in 21 of the last 28 Januaries, from 1998 to 2025.
Read as a buying calendar, December averages have tended to sit below the January that follows, and prices have tended to slip through spring and early summer. Against trend, the lowest readings came in July, September and December. But the margins are thin. Even January fell in 17 of 55 years, and in two more the monthly average did not change.
Gold by month: the full table
The table shows every month’s record across the 55 years, its median change, its record since 1998, and where its price typically sat against the long-term trend.
| Month | Rose / fell / unchanged (of 55) | Median change | Rose 1998 to 2025 (of 28) | Price vs trend (median) |
|---|---|---|---|---|
| January | 36 / 17 / 2 | +1.6% | 21 | +0.1% |
| February | 29 / 21 / 5 | +0.9% | 17 | +0.5% |
| March | 28 / 25 / 2 | +0.3% | 13 | -0.6% |
| April | 25 / 29 / 1 | -0.6% | 14 | +0.4% |
| May | 22 / 31 / 2 | -0.3% | 12 | +0.5% |
| June | 26 / 26 / 3 | 0.0% | 13 | -0.6% |
| July | 27 / 26 / 2 | 0.0% | 12 | -1.3% |
| August | 31 / 21 / 3 | +0.8% | 17 | -0.8% |
| September | 27 / 27 / 1 | 0.0% | 17 | -1.3% |
| October | 27 / 23 / 5 | 0.0% | 13 | +0.2% |
| November | 26 / 27 / 2 | 0.0% | 15 | -0.9% |
| December | 28 / 23 / 4 | +0.3% | 15 | -1.4% |
Change in the World Bank monthly average gold price from the previous month, 1971 to 2025. “Unchanged” months reflect the source’s whole-dollar rounding. Price vs trend compares each month’s average with its centered 12-month moving average. Bullion Trading LLC research.
Why January so often looks like the cheapest month
January was the year’s lowest month in 16 of the 53 years with a single clear low, more than any other month, and December was the year’s highest in 14 of the 51 years with a single clear high. That looks like a strong buy-in-January signal, but most of it comes from gold’s long rise rather than the calendar. In a year when gold climbs, the low tends to come early and the high late, whatever the month. Remove the trend and January is not cheap at all: its median sits about 0.1% above trend. And in the 21 years when gold ended the year lower, with December’s average below that same year’s January, the low came in November or December in 11.
Price versus trend: when gold has sat lowest
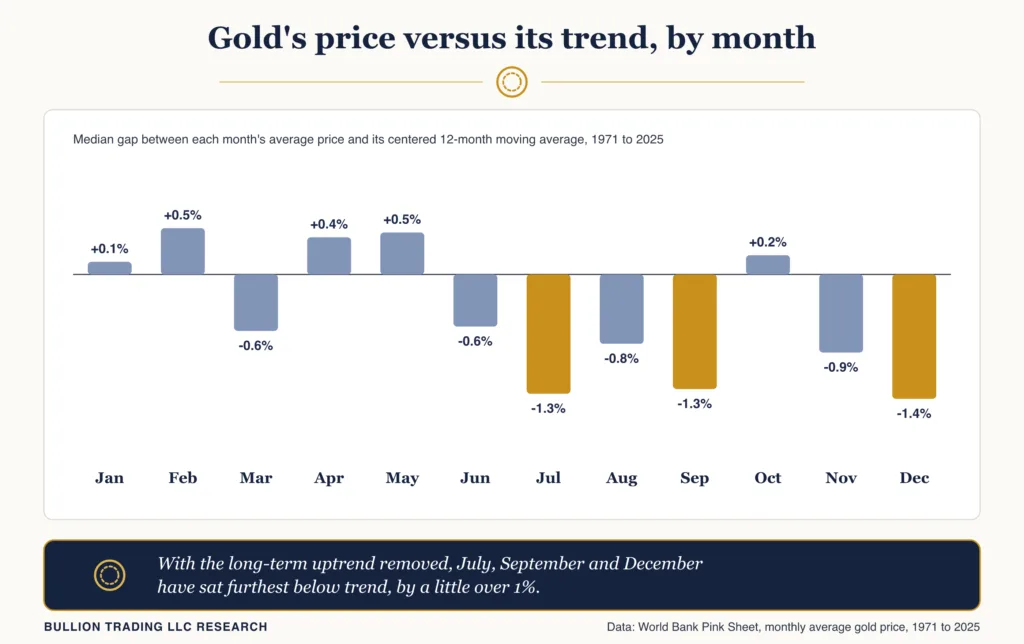
Removing the trend gives a fairer picture. Comparing each month’s average price with a 12-month average centered on it, gold has typically traded furthest below its trend in July, September and December, by about 1.3% to 1.4% at the median, and furthest above it in February and May, by about 0.5%. That fits the January and February strength: prices have tended to sit low in December and run above trend by February.
What the World Gold Council and researchers found
Our results line up with the World Gold Council’s. Looking at LBMA monthly returns since 1971, the council found gold tends to do well “in both January and late summer”, with an average January return of 1.79%, almost three times its long-term monthly average. It called the January effect statistically the strongest, at a 90% confidence level, said it may be related to portfolio rebalancing and a possible response to seasonal weakness in real yields, and noted that it coincides with gold restocking in East Asia ahead of the Lunar New Year, which “could play a role”.
The council also noted that, on its measure, January fell in both 2021 and 2022 (on monthly averages, both edged higher), and that the late summer strength has shifted from September to August over the past two decades. Over our full 55 years August was the second most reliable month, but since 1998 August, September and February each rose in 17 of 28 years, so our data do not show that shift clearly.
Academic work has moved in the same direction. In 2013 Dirk Baur studied gold from 1980 to 2010 and found that September and November were the only months with positive and statistically significant price changes, an “autumn effect” he linked to Indian wedding-season demand, hedging ahead of the stock market’s “Halloween effect”, and negative investor sentiment as daylight shortens. A 2024 replication using daily data from 1981 to 2022 found no month with a statistically significant average return over the full period, and concluded that the autumn effect “has been reversed and replaced by the winter effect”, with January turning positive and significant after 2010.
Physical demand does follow the calendar, which helps explain why the idea persists. The council notes that weddings generate about 50 percent of India’s annual gold demand, that Diwali and Dhanteras are India’s peak buying occasions, and that Chinese jewelers restock ahead of the Spring Festival. For background, see our post on the Diwali festival. The world price, though, is set by far more than festival buying, including interest rates, as our guide to gold and interest rates explains, which is one reason seasonal demand leaves only a faint mark on the price.
How much is the calendar worth?
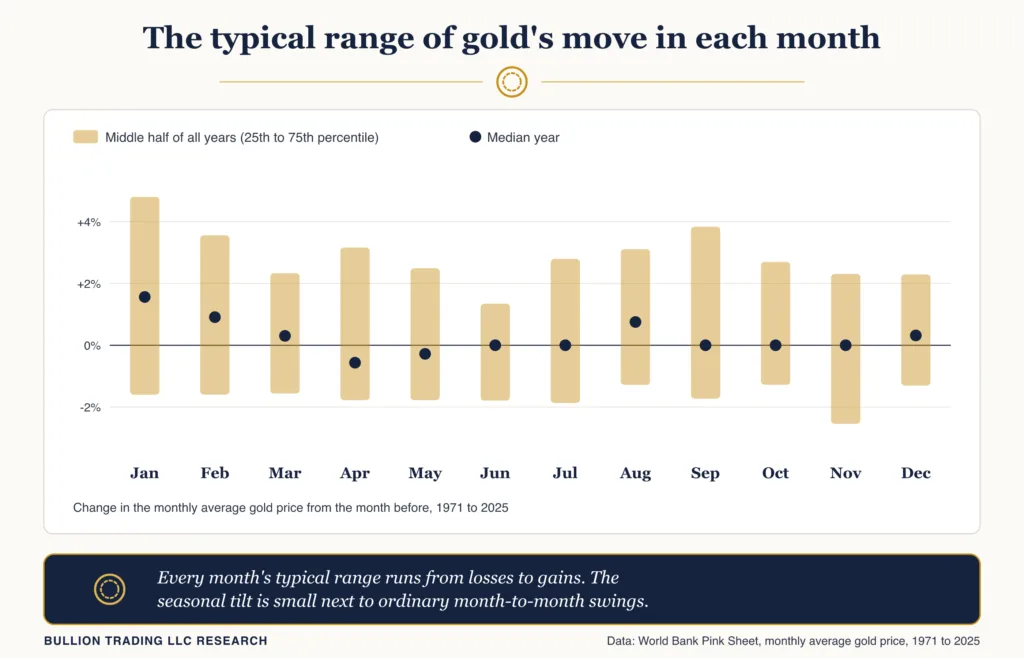
Not much next to ordinary price swings. The middle half of outcomes for every month runs from a loss to a gain, and the median absolute monthly move across all 660 months was 2.3%. The best seasonal readings, a median January gain of 1.6% or a December price about 1.4% below trend, are smaller than what gold does in a normal month. A buyer who picks the “right” month can easily lose that edge to the next month’s move.
2026 shows both sides. Outside our study period, the monthly average rose 10.3% in January and 5.6% in February, then fell every month from March through July before jumping 8.3% in August and slipping 2.1% in September. That loosely fits the old pattern, but one year proves nothing, and the run from record highs in early 2026 was driven by much more than the calendar, as our look at the 2026 gold and silver correction describes.
Bullion Trading research methodology
Prices come from the World Bank’s Pink Sheet monthly gold series, which the monthly workbook linked there describes as a spot average of daily rates from June 2025 and, before that, the average of daily London afternoon fixing prices for 99.5% gold, so the last 7 of our 660 months use the newer basis. We measured each month’s change as its average price against the previous month’s average, for every month from January 1971 to December 2025: 55 of each calendar month, 660 in all. The workbook reports whole dollars, so 32 months show no change at all, spread across the decades; we count those as unchanged rather than up or down. Rounding also makes the early-1970s monthly changes approximate.
The trend comparison divides each month’s average by a centered 12-month moving average and takes the median gap for each calendar month. Medians and means rank the months a little differently: on mean gaps, December and July still sit lowest, but August and November rank below September, and January ranks second only to February at the top. To test whether the months truly differ, we ran a Kruskal-Wallis test on all 660 changes (p = 0.54, no significant difference). For January alone, 36 rises in 55 years has a two-sided binomial p-value of about 0.03, but because we looked at 12 months, the corrected figure is about 0.36. Year-high and year-low counts exclude years where two months tied.
Our numbers differ from the council’s because the measures differ: the council used LBMA afternoon prices from January 1971 to November 2023 and reported average returns along with how often January rose (almost 60% of the time since 1971 and nearly 70% since 2000), while we compare monthly averages and focus on medians and how often each month rose, which keeps one extreme month, such as January 1980’s 48% jump, from dominating. Both find January the strongest month and neither finds a dependable rule. The full dataset is available as a CSV download.
What this means if you are buying gold
The calendar offers a small tilt, not a discount you can count on. December averages have tended to sit below the January that follows, and July, September and December have sat furthest below trend, but the edge is about 1% against typical monthly swings of more than 2%. Many buyers sidestep the timing question by spreading purchases across the year, an approach our guide to dollar-cost averaging into gold and silver explains.
Frequently asked questions
What is the cheapest month to buy gold?
No month is reliably cheapest. After removing the long-term trend, July, September and December have sat lowest, about 1.3% to 1.4% below trend at the median, in Bullion Trading LLC research covering 1971 to 2025.
Does gold go up in January?
More often than not. Gold’s monthly average rose in 36 of 55 Januaries from 1971 to 2025, and the World Gold Council also finds January the strongest month on average, though its measure showed January losses in 2021 and 2022.
Is gold cheaper in the summer?
Slightly, by midsummer. June, July and August all sat below trend at the median, by 0.6%, 1.3% and 0.8%, gaps smaller than gold’s typical monthly move of 2.3%.