
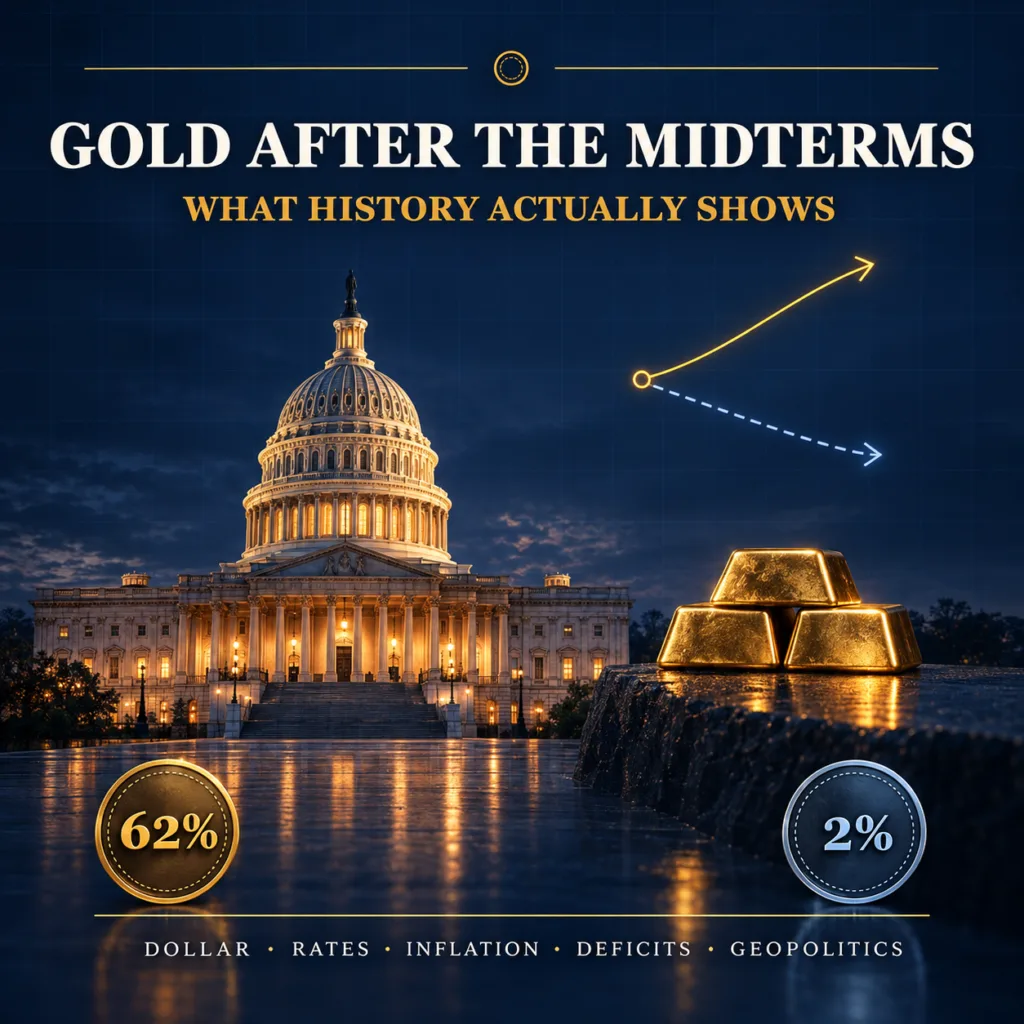
Gold after midterm elections has usually risen: it was higher six months later after 11 of the 14 U.S. midterms since 1970, about 79% of the time, based on World Bank monthly gold prices. The World Gold Council, measuring a different way, found gold rose 62% of the time in its 2022 study. Both reach the same conclusion: gold has risen after midterms more often than it has fallen. The party that won Congress has not been a reliable guide, though: in the council’s regression, only the dollar’s moves were statistically significant. That matters for November 3, 2026: gold was down for the year at the end of September, after rising Treasury yields and a stronger dollar drove that month’s drop.
| Key finding | Result |
|---|---|
| Midterms studied | 14, from 1970 to 2022 |
| Gold higher six months later | 11 of 14, about 79% |
| Median six-month change | About +6% |
| Gold higher 12 months later | 9 of 14, about 64% (median about +16%) |
| Gold higher by the next presidential election | 9 of 14, about 64% (median about +13%) |
| World Gold Council, six months from election day (2022 study) | Higher 62% of the time, median +2% |
| Did a change in party control explain gold’s return? | Not statistically significant in the council’s test (p = 0.18) |
| Did the dollar’s move explain it? | Statistically significant in the same test (p = 0.02) |
Bullion Trading LLC research using World Bank monthly average gold prices; World Gold Council October 2022 commentary.
Does gold usually rise after midterm elections?
Yes, in every window we tested. Six months after the vote, gold was higher after 11 of 14 midterms, with a median change of about +6%. It was higher after 9 of 14 both 12 months later and by the November of the next presidential election, two years on. Gold rose less often over the longer windows, but the typical move was bigger, because two years can take in whole trends: from November 1978 to November 1980 the monthly average price roughly tripled, while from 1974 to 1976 it fell about 29%.
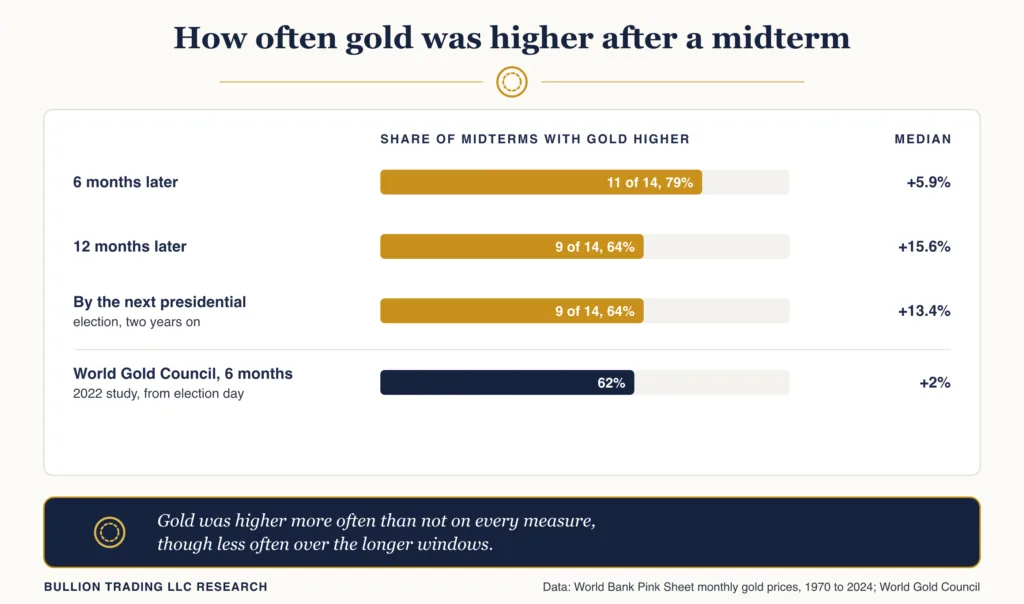
The World Gold Council’s October 2022 commentary used weekly prices and found gold higher 62% of the time six months later, with a median of 2%, while U.S. stocks rose in the six months after every midterm since 1970: midterms were “very positive for equities but only mildly supportive for gold.” The methodology section explains the gap.
Gold after every midterm since 1970
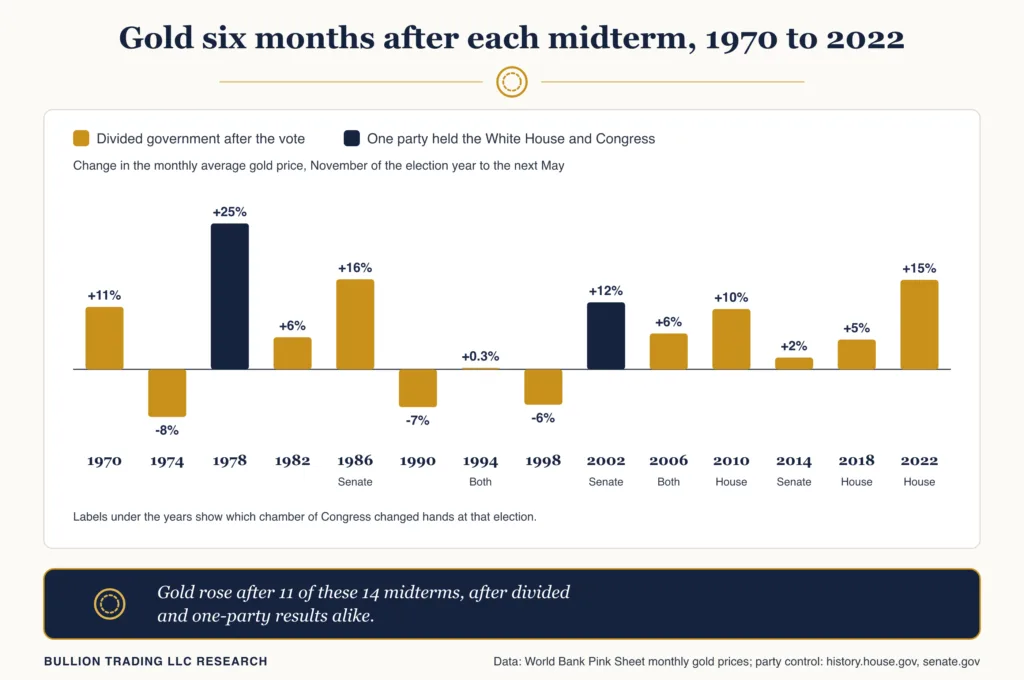
The table lists all 14 midterms and how the monthly average gold price changed after each.
| Midterm | Congress after the vote | 6 months | 12 months | To next presidential election |
|---|---|---|---|---|
| 1970 | Divided, no change | +10.8% | +16.2% | +70.3% |
| 1974 | Divided, no change | -8.2% | -22.0% | -28.6% |
| 1978 | One party (Democratic), no change | +25.2% | +90.3% | +203.4% |
| 1982 | Divided, no change | +5.5% | -8.0% | -17.6% |
| 1986 | Divided, Senate to Democrats | +15.6% | +17.6% | +5.5% |
| 1990 | Divided, no change | -6.5% | -5.8% | -12.3% |
| 1994 | Divided, both chambers to Republicans | +0.3% | +0.3% | -1.6% |
| 1998 | Divided, no change | -6.1% | -0.3% | -9.5% |
| 2002 | One party (Republican), Senate to Republicans | +11.6% | +22.3% | +37.6% |
| 2006 | Divided, both chambers to Democrats | +6.2% | +28.3% | +21.2% |
| 2010 | Divided, House to Republicans | +10.4% | +26.9% | +25.7% |
| 2014 | Divided, Senate to Republicans | +2.0% | -7.6% | +5.4% |
| 2018 | Divided, House to Democrats | +5.2% | +20.5% | +52.8% |
| 2022 | Divided, House to Republicans | +15.5% | +15.0% | +53.7% |
Change in the World Bank monthly average gold price from November of the midterm year to May of the next year, November of the next year, and November of the next presidential election year. “Divided” means the president’s party did not hold both chambers. Bullion Trading LLC research; sources: World Bank Pink Sheet, history.house.gov, senate.gov.
Bullion Trading research methodology
Prices come from the World Bank’s Pink Sheet monthly gold series, which the workbook describes as the average of daily London afternoon fixing prices for 99.5% gold before June 2025 (spot averages since then). The workbook reports whole dollars, so the 1970 results, when gold traded near $40, could be off by up to three or four percentage points, though rounding cannot change whether any midterm was higher or lower.
For each midterm from 1970 to 2022 we compared the November average with the average in May of the next year (six months), November of the next year (12 months) and November of the next presidential election year (about two years). “Higher” means the later average was above the November average, and the median is the midpoint of the two middle values of the 14 changes. Party control after each vote comes from the House Historian’s party divisions and senate.gov. For the five midterms since 2006 we also measured the Federal Reserve’s broad dollar index over the six-month window; the monthly series starts in 2006.
Our 79% differs from the council’s 62% because the inputs and the sample differ: the council measured weekly Tuesday-end LBMA afternoon prices over 26 weeks from election day, in a study published just before the 2022 vote. It does not list its gold sample; if it starts in 1970, like its stock comparison, that is 13 midterms, and 62% would be 8 of them, the only count out of 13 that rounds to 62%. On the same 13 midterms, 1970 to 2018, our method finds 10 higher, about 77%.
We used monthly averages for all 14, including 2022. A November average includes trading days before the vote, and averaging smooths sharp moves, so small results can differ between methods: our 1994 gain was +0.3% against the council’s 1%, and 2014 was +2.0%. Both say gold has risen after midterms more often than it has fallen, and neither shows that the election caused it. The full dataset is available as a CSV download.
Does gold do better when Democrats or Republicans win?
No party has a consistent edge once the dollar is accounted for. In its 2022 commentary, the council tested whether a change in congressional control helped explain gold’s six-month return. That variable came with a p-value of 0.18, too weak to count as significant, while the dollar index’s six-month return came in at 0.02. The council said the results “seem to matter for gold” and that the most favourable scenario for gold “would likely be a surprise Democratic sweep, which looks improbable,” but “once we control for movements in the US dollar index (DXY), the effect is much less pronounced.” Its 2024 study of presidential elections, Ballots to Bullion, likewise found that “none of these results are statistically significant.”
Our table points the same way: the two one-party results, 1978 under Democrats and 2002 under Republicans, were followed by six-month gains of about 25% and 12%, and the 12 divided outcomes produced nine gains and three declines. With so few cases, none of that supports a rule.
Why divided government can still matter for gold
When the House majority changes, it has usually been at a midterm, though most midterms leave it in place: of 19 majority changes since the 1850s, more than three-quarters came at a midterm, the House Historian notes. A new majority can make budgets, debt limits and spending bills harder to pass.
Funding fights are the most direct link. A government-wide shutdown ran from October 1 to November 12, 2025, 42 full days, according to the Congressional Research Service, and the current stopgap law funds the government only through December 11, 2026, less than six weeks after the election, with a lame-duck Congress in charge. None of this moves gold directly; it matters only if it changes the dollar, Treasury yields, inflation expectations or demand for safe-haven assets.
What moves gold more than the election result
The table sums up five forces that have mattered more than the party labels, and a recent reading for each. For background, see our guides to gold and interest rates, gold and the government debt and gold prices during military conflicts.
| Driver | Has tended to help gold when | Has tended to weigh on gold when | Recent reading |
|---|---|---|---|
| U.S. dollar | The dollar weakens | The dollar strengthens | The dollar index rose 2% in September, per the World Gold Council |
| Interest rates | Yields fall, lowering the cost of holding gold | Yields rise | 10-year Treasury yield at 5.3% in September, per the council; the Fed raised its target range to 3.75% to 4% |
| Inflation | Inflation persists and erodes confidence in the dollar | Inflation falls back | The Fed’s September 16 statement: “Inflation remains elevated” |
| Deficits and debt | Deficits and interest costs keep climbing | The fiscal outlook improves | CBO estimates a fiscal 2026 deficit of $2.0 trillion; net interest on the public debt was $1.143 trillion, up 11% |
| Geopolitical risk | Wars, sanctions or trade conflicts flare | Tensions ease | In the council’s Gold Outlook 2026 (data to November 28, 2025), a high-risk environment explained about 12 points of gold’s 2025 return |
Directions describe typical past relationships, not guarantees. Sources: World Gold Council; Federal Reserve; Congressional Budget Office.
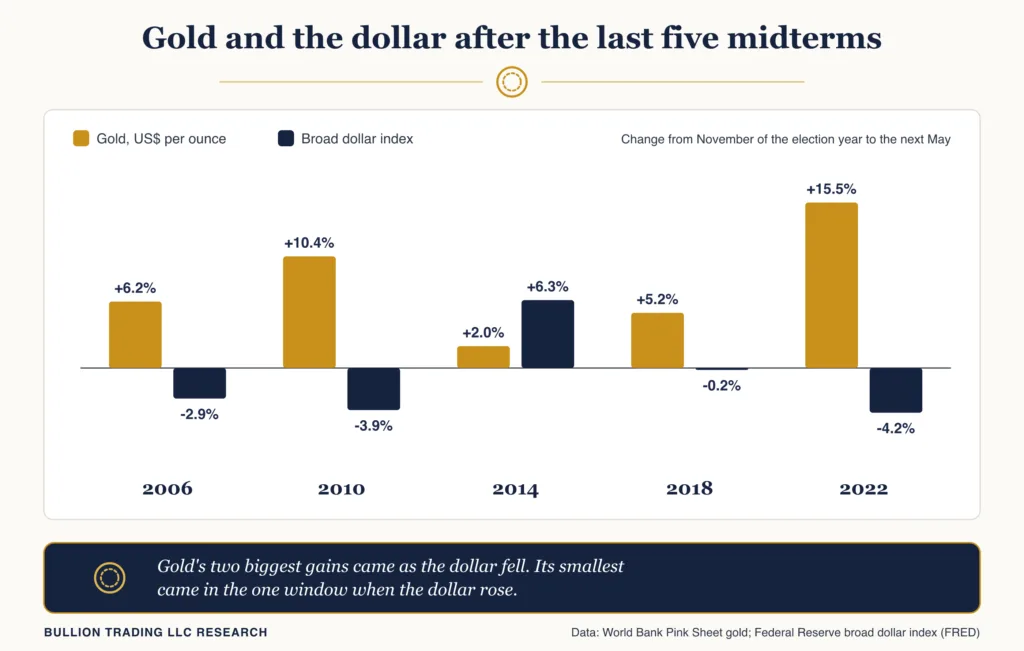
The dollar is the one driver of the five we measured after midterms, and it lines up with gold. Comparing November with the following May, gold’s two biggest gains of the last five midterms, after 2010 and 2022, came while the Federal Reserve’s broad dollar index fell about 4%, and its smallest, after 2014, came in the only one of those windows when the dollar rose.
2010: Gold rose 10% to 13%, but was it really the midterms?
Republicans gained more than 60 House seats and the majority in 2010, according to the House Historian’s party tables, while Democrats kept the Senate under President Obama. Gold then rose 13% over six months on the council’s measure, and about 10% on our monthly averages.
The calendar points somewhere else. The election was on November 2, 2010. The next day the Federal Reserve announced it would buy a further $600 billion of longer-term Treasury securities “by the end of the second quarter of 2011,” a program scheduled to run to the end of June 2011, past the end of either six-month window, and the broad dollar index fell about 4% over our window. The new House majority may have added uncertainty, but the Fed and the dollar are at least as good an explanation for gold’s gain as the vote.
Where gold and Congress stand before the 2026 midterms
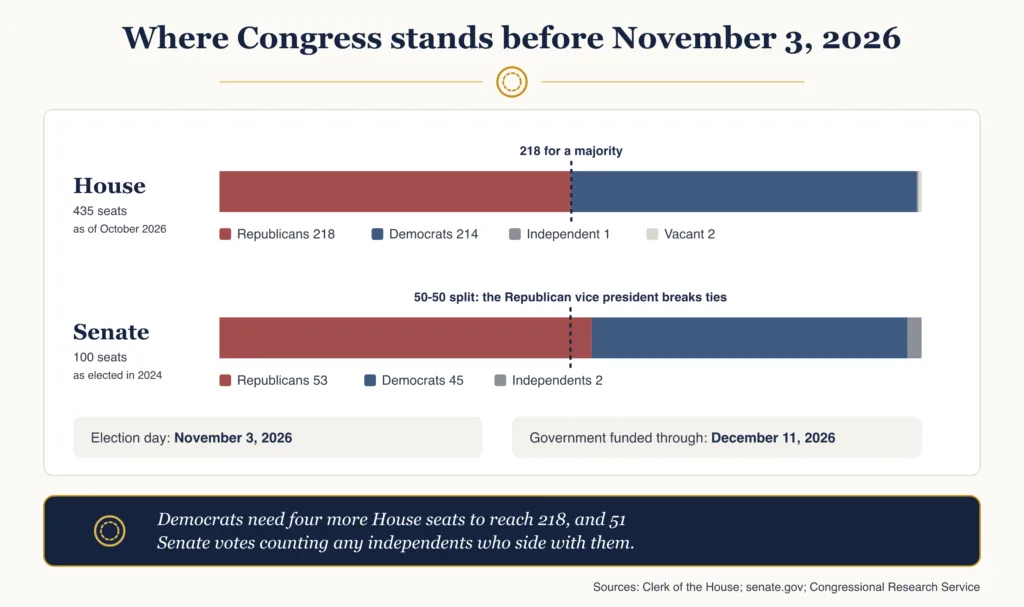
Republicans go into November 3 with 218 House seats to the Democrats’ 214, plus one independent and two vacancies, according to the Clerk of the House, so Democrats need four more seats to reach 218. In the Senate, the 2024 election left Republicans with 53 seats, Democrats 45 and independents two, according to senate.gov. Democrats would need 51 votes, counting any independents who side with them, because the Constitution gives the vice president, now a Republican, a vote when the Senate is “equally divided.”
Gold ended September about 23% below its January record. The World Gold Council’s September 2026 commentary reports that gold finished the month at US$4,176 an ounce, 8.5% lower for the month and down 4.4% for the year, after a record of US$5,405 on January 29, and its model pointed to rising yields and a stronger dollar. The forces that matter more than the election have lately been pulling against gold, which is worth remembering before leaning on any historical hit rate.
Could either election outcome support gold?
A Democratic House, or a Democratic sweep, would bring divided government and likely more confrontation over spending once the new Congress is seated in January. If that uncertainty weighed on the dollar, it would act through the one factor the council’s midterm test found significant. A Republican hold would give the administration more room for its fiscal and trade agenda, and deficits, tariffs and inflation risk are conditions gold buyers have long watched, as our article on tariffs and gold explains. Either result also has bearish versions: a stronger dollar, higher real interest rates, falling inflation or calmer geopolitics could pressure gold no matter who controls Congress.
What history says about gold after midterm elections
Gold has been higher after midterms more often than not, in our data and in the World Gold Council’s. Party control has not been a statistically significant guide once the dollar is included, and 2010 shows how hard it is to separate an election effect from a Fed decision announced the next day. For 2026, watch what the result does to deficits, the Fed, Treasury yields and the dollar, and whether the December funding deadline turns into another standoff.
Frequently asked questions
Does gold normally rise after midterm elections?
More often than not. The World Gold Council found gold higher six months after 62% of midterms from 1970 to 2018, with a median gain of 2%.
Does gold do better when Democrats or Republicans control Congress?
The evidence does not show a reliable party effect. In the council’s 2022 test, a change in congressional control was not significant once the dollar was taken into account.
Is divided government good for gold?
It can add fiscal confrontation and uncertainty, but divided government alone has not guaranteed gains. The 2010 example coincided with a $600 billion Fed bond-buying program and a falling dollar.
What should gold buyers watch after the 2026 midterms?
The dollar, Treasury yields, the Fed’s next moves, the December 11 funding deadline, deficits, tariff policy, inflation and geopolitical developments are likely to matter more than the party labels