
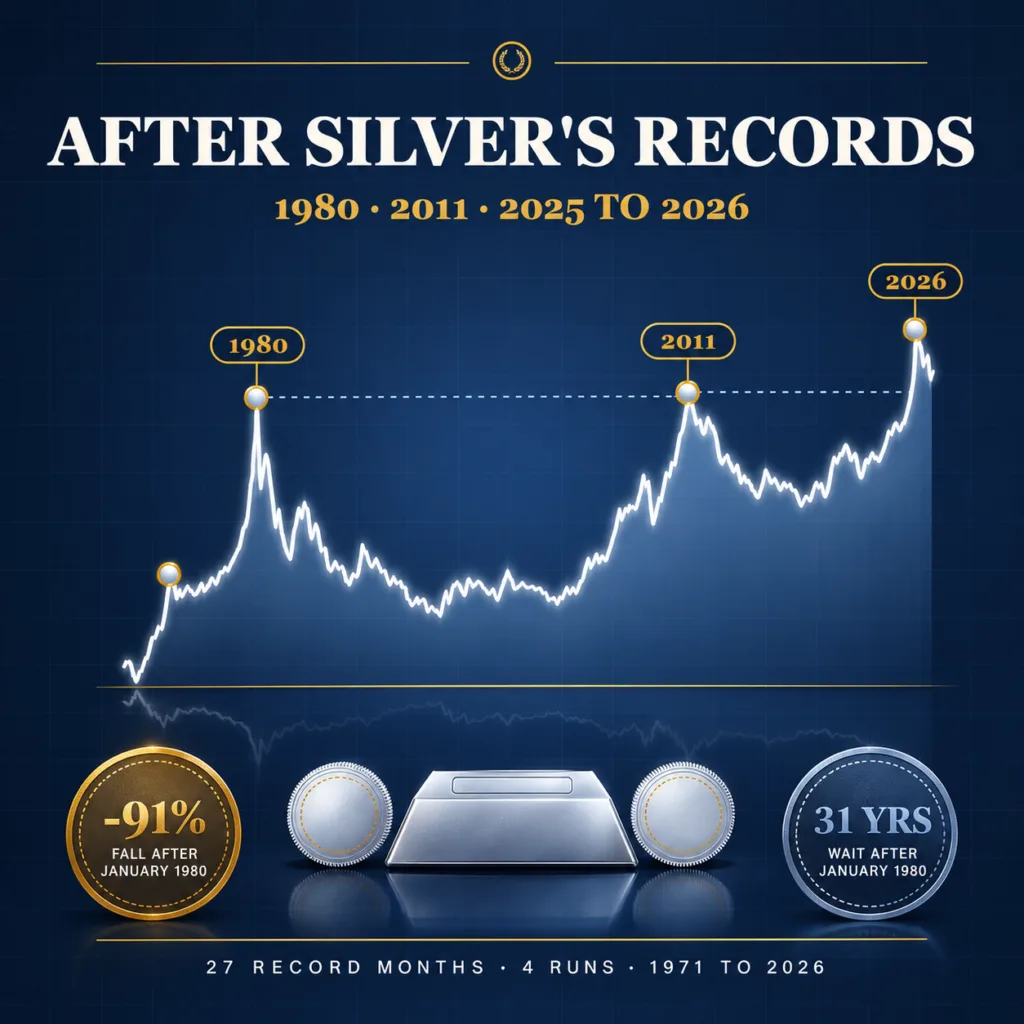
Silver after record highs has followed a harsher script than gold. Bullion Trading LLC research on World Bank monthly silver prices from January 1971 to September 2026 counts 27 record months, months whose average beat every month before them, in four runs: 1973 to 1974, 1978 to January 1980, April 2011, and September 2025 to January 2026. A year after a record month, silver was usually higher, in 19 of 23 cases. Three years out it was higher in only 10 of 22, less often than after an ordinary month. After January 1980 the monthly average fell 91% and took more than 31 years to set another record; after April 2011 it fell 67% and took more than 14 years. By September 2026 it was 30% below January 2026’s record average, and after inflation that record was still 43% below January 1980’s.
| Key finding | Result |
|---|---|
| Months studied | 669, from January 1971 to September 2026 |
| Record months | 27, in four runs: 1973 to 1974, 1978 to 1980, April 2011, 2025 to 2026 |
| Silver higher a year after a record month | 19 of 23 (83%), median gain 63% |
| Silver higher a year after any month | 343 of 657 (52%), median gain 2% |
| Silver higher three years after a record month | 10 of 22 (45%), against 59% for any month |
| Fall after January 1980 | 91% on monthly averages, to March 1993; next record April 2011 |
| Fall after April 2011 | 67%, to December 2015; next record September 2025 |
| Fall after January 2026 so far | 36% to July 2026; September 2026 was 30% below |
| January 2026 record after inflation | 43% below January 1980’s monthly average |
Bullion Trading LLC research using World Bank monthly average silver prices and the BLS CPI-U. Method below.
How often silver rose after a record month
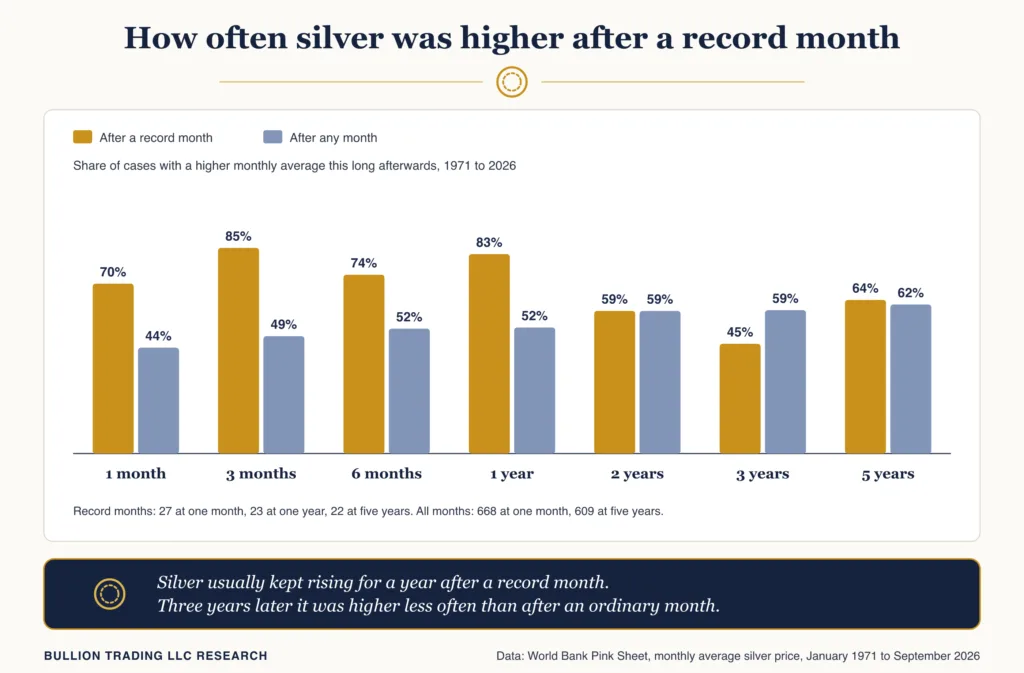
A silver record month was usually followed by a strong year. One year later the monthly average was higher in 19 of 23 cases, about 83%, with a median gain of 63%, against 52% and 2% for any month. Records come during strong rallies, and silver’s rallies have tended to keep going for a while once they start.
The edge then reversed. Two years after a record month, silver was higher 59% of the time, the same as for any month, and three years out only 45%, below the 59% for an ordinary month, with a median loss of about 10%. At five years the two were level again at about 62% to 64%. Most of these cases come from the 1978 to 1980 run, so the pattern rests on a handful of episodes, but it fits silver’s reputation: big rallies that give back much of their gain.
Every run of silver record highs since 1971
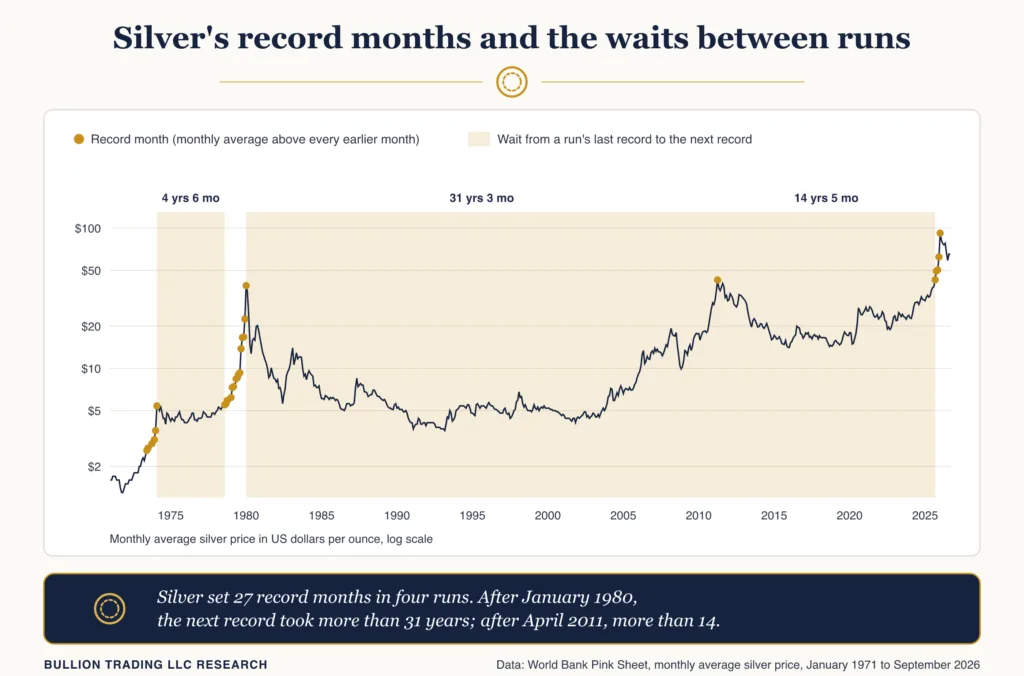
Silver set far fewer records than gold over the same period, 27 record months against gold’s 81, and they came in four runs, listed below with what followed each.
| Run | Record months | Peak monthly average | 12 months after first record | Fall after last record (lowest month) | Wait for next record |
|---|---|---|---|---|---|
| Jun 1973 to Feb 1974 | 6 | $5.40 | +88% | -26% (Sep 1974) | 4 years, 6 months |
| Aug 1978 to Jan 1980 | 15 | $38.90 | +69% | -91% (Mar 1993) | 31 years, 3 months |
| Apr 2011 | 1 | $42.70 | -26% | -67% (Dec 2015) | 14 years, 5 months |
| Sep 2025 to Jan 2026 | 5 | $92.10 | +51% | -36% so far (Jul 2026) | None yet as of Sep 2026 |
Monthly average silver price, World Bank Pink Sheet, January 1971 to September 2026. A new run starts when a record comes more than 12 months after the previous one. Bullion Trading LLC research.
The four record months followed by a lower price a year later were February 1974, December 1979, January 1980 and April 2011, each the last or next to last record of its run. As with gold, the danger sat at the end of a run, and nobody could see the end from inside it.
Silver’s three big tops: 1980, 2011 and 2026
The January 1980 top was built on a squeeze. Members of the family of Texas oilman H.L. Hunt, among them brothers Nelson Bunker and William Herbert Hunt, and related entities held more than 195 million ounces by the end of 1979, according to a 1982 SEC staff report, which put Comex’s intraday high at $50.36 in January 1980. The exchanges fought back: Comex imposed emergency speculative position limits on January 7, 1980, and on January 21 restricted trading to liquidation only, after which spot silver fell about $10 in a day. By Silver Thursday, March 27, it had settled at $10.80. Our history of the Hunt brothers tells that story in full. On monthly averages, silver fell from $38.90 in January 1980 to $3.60 in March 1993.
The 2011 top lasted a single record month. The London fix peaked at $48.70 on April 28, 2011, and starting April 25, CME Group raised margins five times in less than two weeks, taking the initial margin for a speculative silver contract from $11,745 to $21,600, an 84% increase. Comex silver lost 27.4 percent in the week to May 6, which Bloomberg called its worst week “since at least 1975”. The slide lasted years: the monthly average bottomed at $14.10 in December 2015 and January 2016.
The latest run gathered pace with a London shortage. Spot silver reached $50 on October 9, 2025 for the first time in decades, and the Silver Institute described “an unprecedented liquidity squeeze in October 2025”. Prices then “surged to an all-time high above $121 on January 29”, the institute wrote, and on January 30, after President Trump nominated Kevin Warsh to succeed Jerome Powell as Fed chair, silver fell 26% in a day, according to Standard Chartered. Our coverage of the January 2026 crash walks through that day. By July the monthly average was down to $58.80, 36% below January’s $92.10, and silver futures traded near $56.45 an ounce on October 22, 2026.
Silver’s record highs after inflation
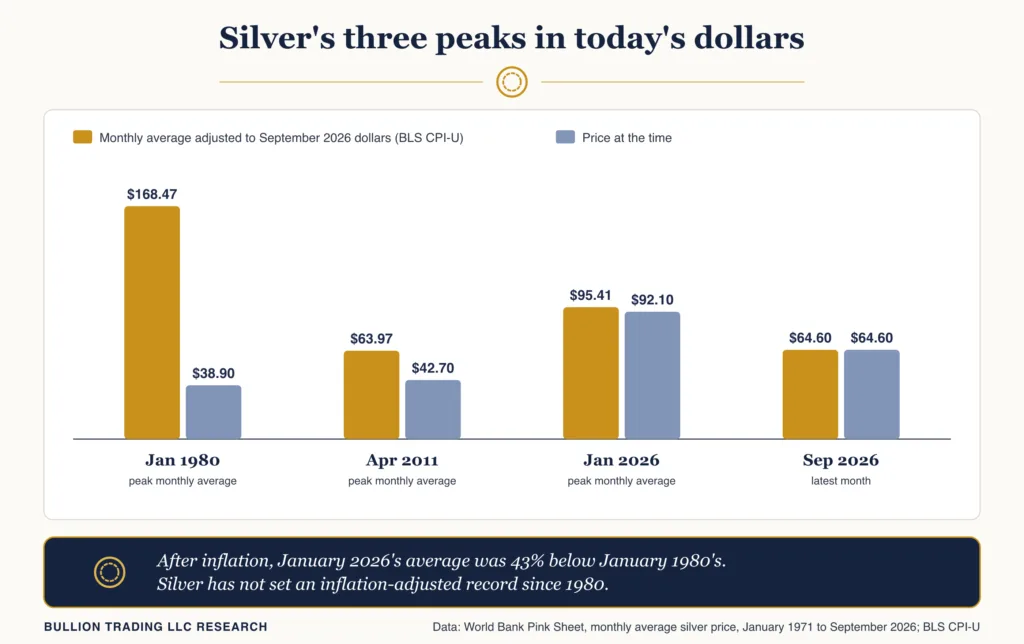
Adjusted for US consumer prices, January 1980’s monthly average of $38.90 is worth about $168 in September 2026 dollars, and silver has not beaten it since. January 2026’s record average of $92.10 equals about $95 in today’s money, 43% below the 1980 figure, and April 2011’s $42.70 about $64. Measured from daily highs, the gap is about the same: Comex’s $50.36 intraday high of January 1980 is worth about $218 in today’s dollars, against about $126 for the $121.79 high Comex silver futures reached in 2026. Silver set only 10 record months in real terms over the whole period, all between 1974 and January 1980.
The backdrop this time is tighter supply. The Silver Institute’s World Silver Survey 2026 estimates a 2025 market deficit of 40.3 million ounces and forecasts another of 46.3 million ounces in 2026, which “would be the sixth in a row”, and silver joined the US government’s final 2025 list of critical minerals. Our earlier look at silver supply tightness covers the deficit debate. Deficits have not prevented the fall since January, though.
Bullion Trading research methodology
Prices come from the World Bank’s Pink Sheet monthly silver series, which the monthly workbook describes as the London afternoon fixing for 99.9% refined silver, and Handy & Harman before July 1976. The study covers every month from January 1971 to September 2026, 669 in all. A record month is one whose average beat every earlier monthly average back to January 1960; a new run starts when a record comes more than 12 months after the one before. For each month we measured the change in the monthly average 1, 3, 6, 12, 24, 36 and 60 months later. Inflation adjustments use the BLS CPI-U, not seasonally adjusted, with October 2025 filled as the average of September and November because BLS did not publish it.
The workbook rounds silver to the nearest 10 cents, so small early moves are approximate and many months show no change, which pulls down the share of “any month” that rose over short periods. Although the workbook labels its series the London fixing, several of its figures since August 2025 differ from the LBMA averages the Silver Institute publishes (September 2025: $42.80 against $42.54; December 2025: $62.30 against $64.34), and that decides one record: on World Bank data September 2025 beat April 2011’s $42.70 by one 10-cent step, while on the LBMA average it would not have. Without September 2025, silver was higher a year after 18 of 22 record months; on every price series, October 2025’s $49.40 was a clear nominal record.
Monthly averages sit well below daily highs: January 1980’s $38.90 compares with a $50.36 intraday Comex high, and January 2026’s $92.10 with a high above $121. Because records cluster and their windows overlap, the four runs are the honest sample size, so we did not attach p-values. Most of the record months come from the 1970s runs: of the 23 with a full year of data, 21 are from 1973 to 1980, and only two (April 2011, which fell, and September 2025, which rose) come from the past 40 years. The full dataset is available as a CSV download.
What this means if you are buying silver at a record
Silver’s history after record highs is more extreme than gold’s in both directions. The year after a record has usually been good, and the years after the last record of a run have been brutal: falls of 26% to 91% on monthly averages, and waits from four and a half to more than 31 years for a new high. Since there is no reliable way to tell which record is the last, many silver buyers spread purchases over time, an approach our guide to dollar-cost averaging into gold and silver explains, and our study of gold after record highs shows how much milder gold’s falls were.
Frequently asked questions
What is silver’s all-time high?
It depends on the price series. Silver traded above $121 on January 29, 2026, according to the Silver Institute. On monthly averages, January 2026’s $92.10 is the record. After inflation, January 1980’s average remains the highest.
How long did silver take to recover after 1980?
On monthly averages, silver did not beat January 1980’s $38.90 until April 2011, 31 years and 3 months later. After inflation it still has not.
How far has silver fallen after a record high?
After the last record of each run, silver’s monthly average fell 26% (1974), 91% (1980 to 1993) and 67% (2011 to 2015). After January 2026 it had fallen 36% by July 2026.