The U.S. stock market is overvalued by almost every measure, and everybody knows it. But here’s the critical insight: valuation itself doesn’t matter until it does. Dr. Robert Shiller’s Cyclically Adjusted Price-to-Earnings (CAPE) ratio, the same measure that reached extreme levels before 1929 and 1999, now stands at one of the highest levels in history. As of October 22, 2025, the CAPE ratio stands at 39.51, significantly exceeding the 1929 bubble peak (32.56) and exceeded only by the 1999 dot-com mania (44.20).
In the previous episodes when CAPE reached extreme levels, the decade that followed brought flat or negative stock returns. But here’s what most investors miss: during those same periods, gold dramatically outperformed. From 1929 through the 1940s, stocks went nowhere while gold’s official price was revalued higher. From 2000 to 2011, the S&P 500 barely broke even, yet gold surged more than five-fold. While past patterns don’t guarantee future results, the historical correlation between extreme valuations and subsequent gold outperformance is noteworthy.
Understanding this relationship isn’t academic, it’s essential for wealth preservation. As market analyst Tom McClellan notes, “valuation is a condition, not a signal.” While high valuations don’t predict exact timing, they substantially increase the probability of lower returns over the next decade. Based on historical patterns, those expectations favor strategic consideration of alternative assets like gold alongside traditional equity strategies.
Understanding the Shiller CAPE Ratio: A Condition, Not a Signal
Nobel laureate economist Dr. Robert Shiller developed the Cyclically Adjusted Price-to-Earnings ratio to address a fundamental problem: traditional P/E ratios fluctuate wildly with short-term earnings volatility. The CAPE ratio smooths these fluctuations by dividing current stock prices by the average of ten years of inflation-adjusted earnings, creating a more stable valuation benchmark.
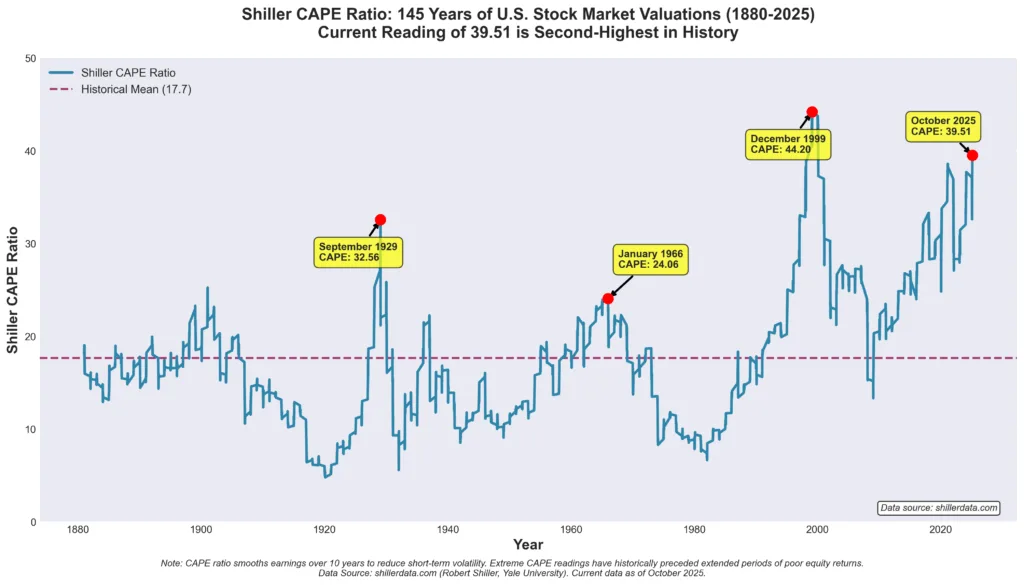
According to historical data extending back to 1871, the CAPE ratio has averaged approximately 17.65. Readings above 30 have preceded major market declines. At the current level of 39.51, the stock market trades in the 98.7th percentile of all historical valuations, exceeded only once in 154 years, during the December 1999 dot-com peak (44.20).
But as McClellan Financial Publications emphasizes, valuation is a “condition, not a signal.” It doesn’t tell you when markets will correct, only that historically, elevated CAPE readings have been associated with compressed or negative probability-weighted expected returns over the coming decade. This is correlation, not causation, but the relationship has been remarkably consistent across multiple cycles.
Historical Context: When CAPE Reached These Extremes
September 1929: CAPE peaked at 32.56 before the Great Depression crash. The Dow fell 89% by 1932 and didn’t recover to 1929 levels until 1954, 25 years later.
January 1966: CAPE reached 24.06 during the “Go-Go Years” market peak. The subsequent 16-year period delivered zero real returns for stock investors. This secular bear market saw gold dramatically outperform, rising from $35 per ounce after the 1934 Gold Reserve Act revaluation to over $850 by 1980, a gain exceeding 2,300%.
December 1999: CAPE reached an unprecedented 44.20 at the dot-com peak, the highest reading in history. The S&P 500 fell 49% from 2000 to 2002, and declined 15% nominally from January 2000 to December 2010 (approximately 20-25% after inflation). Meanwhile, gold rose from $275 to over $1,900 by 2011, nearly a 600% gain.
October 22, 2025: CAPE now stands at 39.51, higher than 1929 (32.56) and 1966 (24.06), and second only to the December 1999 peak (44.20). This marks the second-highest valuation in 154 years of U.S. stock market history.
What CAPE Predicts: The 10-Year Forward Return Relationship
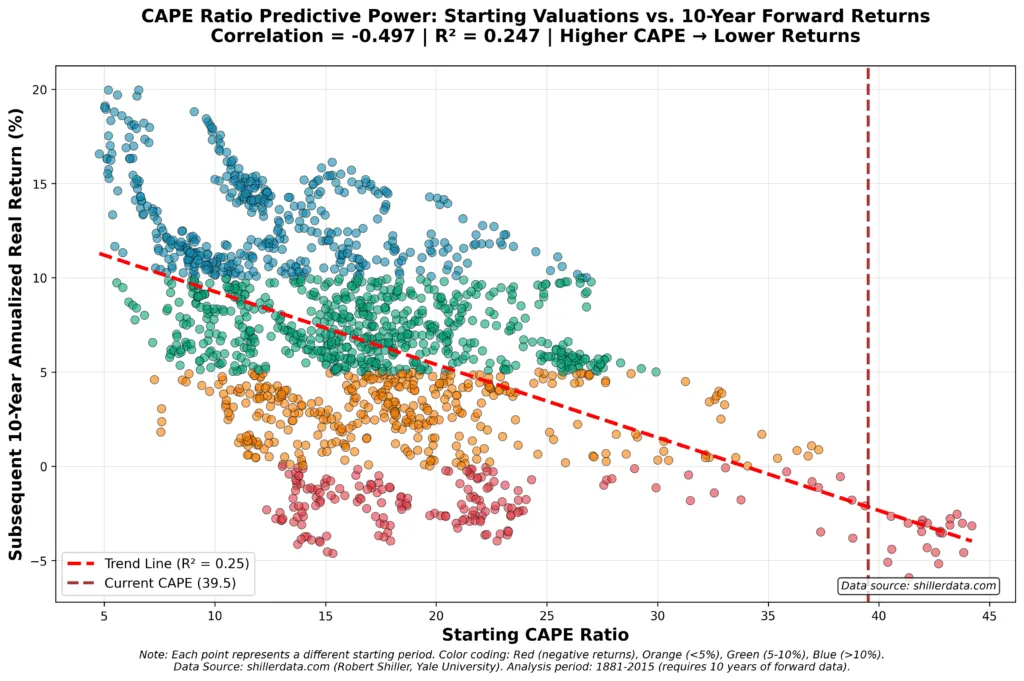
Research shows that starting valuations explain approximately 25% of the variation in subsequent 10-year real stock returns (R² = 0.247). At current CAPE levels of 39.51, historical patterns suggest probability-weighted 10-year returns averaging approximately 0-3%, compared to the long-term average of ~7%. While Federal Reserve research demonstrates that macroeconomic factors and structural changes may justify somewhat elevated valuations, the historical peaks in 1929, 1966, and 2000 were all followed by extended periods of poor equity returns.
As McClellan notes, “Buy and hold investing has its place at certain times in history… But those times were when the market was coming off a very low CAPE reading.” Based on historical patterns, though not guarantees, we may be entering a period when strategic asset allocation becomes more important.
Why Buy-and-Hold Faces Challenges After Extreme Valuations
The conventional wisdom that “the market always comes back” is incomplete. When you start at extreme valuations, recovery might take a decade or longer. Financial markets exhibit mean reversion, when valuations reach extremes, they eventually return toward historical averages through price declines, sideways markets, or inflation.
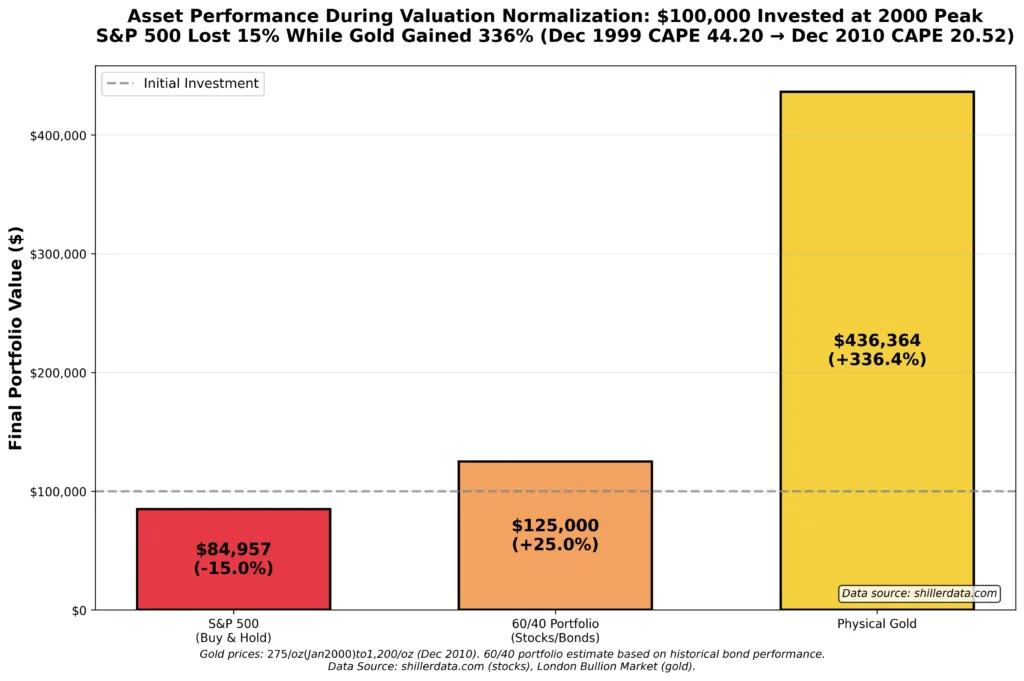
Consider the 2000 market peak: An investor with $100,000 in the S&P 500 saw that investment decline to approximately $85,000 by 2010, a 15% nominal loss, or roughly 20-25% after inflation. The S&P 500 fell from 1,461 in January 2000 to 1,242 in December 2010. Meanwhile, gold rose from $275 to $1,200 per ounce, turning that same $100,000 investment into $436,000. While past performance doesn’t guarantee future results and gold carries its own volatility, the wealth divergence illustrates the opportunity cost of buy-and-hold during valuation normalization periods.
Gold’s Historical Performance After Extreme Stock Valuations
1929-1940s: After the 1929 peak (CAPE 32.56), stocks fell 89% and didn’t recover until 1954. Gold was officially revalued from $20.67 to $35 per ounce in 1934, preserving purchasing power, though private ownership was restricted during much of this period.
1965-1982: Following the 1966 peak (CAPE 24.06), stocks delivered zero real returns for 16 years while gold rose from $35 to over $850, exceeding 2,400%. Gold subsequently corrected sharply through the 1980s-1990s.
2000-2011: After the dot-com peak (CAPE 44.20), stocks declined 15% nominally through 2010, and experienced two bear markets (2000-2002, 2007-2009). Meanwhile, gold surged from $275 to over $1,900 (roughly 600%). Gold then corrected from 2011-2015 before resuming its upward trend.
The 2025 Setup: Today’s CAPE of 39.51 presents similar conditions. While exact timing and magnitude remain uncertain, the historical pattern suggests elevated stock valuations have been followed by periods of relative gold outperformance. Whether this repeats depends on numerous factors including monetary policy, inflation dynamics, and investor behavior.
Why Gold May Outperform During Valuation Normalization
Several factors may explain gold’s historical pattern, though relationships are complex and not deterministic:
No Valuation Ceiling: Unlike stocks constrained by earnings, gold can appreciate based on safe-haven demand when investors lose confidence in overvalued assets, though it carries risks including lack of yield and potential for bear markets.
Monetary Policy Response: Market corrections often prompt accommodative policy, lower rates, quantitative easing, historically associated with gold appreciation. The Federal Reserve’s 2025 policy stance reflects ongoing debates about rates and inflation.
Fiscal Concerns: Government debt exceeding $36 trillion may support hard asset interest, though the relationship isn’t mechanical, debt remained elevated during 2013-2019 when gold largely traded sideways.
Strategic Positioning and Implementation
For investors concerned about valuation risk, tactical adjustments may include moderating equity exposure and evaluating precious metals allocation, though all approaches involve trade-offs:
Portfolio Adjustments: Some investors shift from aggressive equity exposure (70-90% stocks) toward moderate positioning (45-55%), recognizing this means potentially missing gains if markets continue rising. Raising precious metals allocation from 5-10% toward 15-25% may provide diversification, though gold carries its own volatility and produces no income.
Physical Metals: Physical gold and silver provide direct ownership without counterparty risk. Popular sovereign coins like American Gold Eagles offer high liquidity, while gold bars from recognized refiners provide lower premiums. Precious metals IRAs offer tax advantages, though physical metals are taxed as collectibles (28% maximum federal rate).
Gradual Implementation: Dollar-cost averaging over 3-6 months may reduce timing risk, though it doesn’t eliminate the possibility of buying before a correction. Maintaining 10-15% cash provides flexibility but guarantees real losses during inflation.
In the three previous instances of extreme CAPE readings, gold subsequently outperformed stocks, though results varied significantly and gold experienced severe corrections in the 1980s-1990s and 2013-2015. Central banks continue accumulating gold, though buying patterns don’t guarantee price appreciation.
Addressing Counterarguments
“This Time Is Different”: Similar arguments preceded every peak, electrification in 1929, conglomerates in 1965, the internet in 2000. While structural changes are real, they don’t suspend the reality that extreme starting valuations constrain future returns. Recent CFA Institute research suggests CAPE may have undergone a structural shift in 1991, with weaker mean reversion since then, implying high CAPE still predicts lower returns but may not revert to historical average levels of 17.65.
Missing Further Gains: Markets can extend further, CAPE reached 44.20 in 1999 versus today’s 39.51. Investors reducing exposure risk missing additional gains if the bubble continues. However, starting from CAPE 39.51, historical median 10-year returns have been near zero or negative. There’s no clear “right” answer, and those who reduced exposure in 1996 or 2016 underperformed significantly.
Gold’s Lack of Yield: Gold produces no cash flows, causing it to underperform income-producing assets during stable periods (1980-2000, 2011-2019). Its potential value emerges after extreme stock valuations, where historical episodes showed substantial outperformance. However, this pattern is probabilistic, gold’s performance depends on monetary policy, inflation, and safe-haven demand that may not manifest identically in future cycles. At CAPE 39.51, equities are expensive, but that doesn’t guarantee gold will outperform over any specific timeframe.
Conclusion: Valuation Extremes and Strategic Positioning
The U.S. stock market’s CAPE ratio of 39.51 places it in rarely-visited territory, exceeded only once in 154 years at the December 1999 peak. While elevated valuations provide limited insight into near-term direction, historical evidence shows meaningful correlation (R² = 0.247) with lower 10-year real returns for buy-and-hold investors.
After previous extreme peaks (1929, 1966, 2000), stocks delivered poor returns while gold outperformed substantially, though gold also experienced its own severe corrections (1980s-1990s, 2011-2015). These patterns suggest a relationship between extreme equity valuations and subsequent gold outperformance, though the mechanism (correlation not causation) and variability counsel against deterministic expectations.
For investors concerned about valuation risk, strategic positioning may involve moderating equity exposure and considering precious metals allocation, though such approaches involve career risk, psychological challenges, and potential underperformance if equities continue appreciating. The evidence base suggests defensive positioning may offer favorable risk-adjusted prospects, though considerable uncertainty remains about timing, magnitude, and whether historical relationships will persist.
At Bullion Trading LLC, we help investors implement precious metals allocations as part of diversified strategies. Contact our team to discuss whether precious metals align with your investment objectives and risk tolerance. With CAPE at 39.51, a level exceeded only once in modern history, some investors view precious metals as a strategic portfolio component, though each investor’s circumstances require individualized assessment.