Here’s something that might surprise you: the Federal Reserve wasn’t always the inflation machine everyone loves to criticize. When it launched back in 1913, the Fed actually operated on principles that would seem almost alien today. We’re talking about real decentralization, responsiveness to economic cycles, and money creation tied to genuine business activity, not government spending sprees. And here’s the kicker: the dollar was anchored to gold, which kept both the Fed and Washington on a tight leash.
Understanding how we got from that sensible system to today’s debt-fueled mess explains why gold isn’t just doing well, it’s entering what looks like a structural bull market with serious staying power.
According to Federal Reserve historical archives, the original Federal Reserve Act of 1913 set up a deliberately decentralized system with 12 regional banks that had real autonomy. Different parts of the country had different economic cycles. The system provided currency that expanded and contracted with economic activity.
The Original Federal Reserve: Gold Standard Discipline
The early Federal Reserve looked different from today’s centralized system. Each regional bank had independence, responding to regional economic conditions. Money moved with the seasons, when farmers planted crops, capital flowed to agricultural regions. Come harvest time, those funds moved back to financial centers.
The Fed primarily lent against commercial paper representing real economic transactions, though it could also purchase government securities. According to Federal Reserve historical documentation, the system was designed to provide elastic currency tied to economic activity rather than primarily financing government deficits.
Commercial paper matures, typically in 90 days. When the note comes due and gets paid off, the money created against it naturally contracts. This created a self-limiting mechanism tied to business cycles.
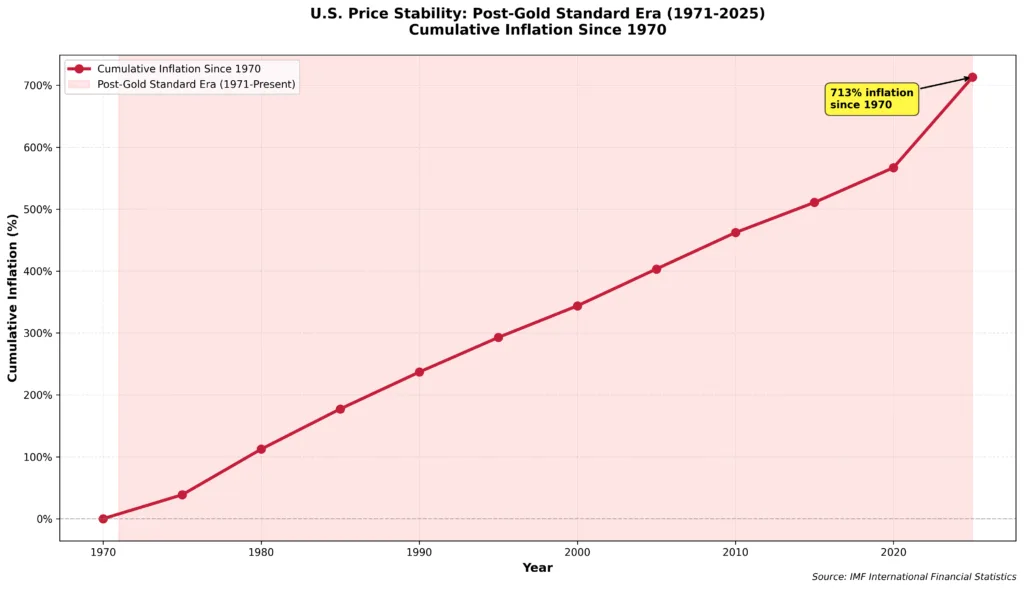
As we’ve examined in our analysis of gold and inflation dynamics, the gold standard period from 1880 to 1914 showed relatively stable price levels compared to the post-1971 era, though economists debate whether this stability came at the cost of reduced economic flexibility during downturns.
World War I Through Nixon: The Unraveling
Then World War I happened, and everything changed. Total federal spending in 1916 sat at around $713 million according to Office of Management and Budget historical tables. By 1919, it had exploded to $18.5 billion, a 2,500% increase.
Washington did something that violated the Fed’s founding principles: it pressured the Federal Reserve to buy government bonds directly. According to Federal Reserve historical analysis, the Fed purchased $2 billion in Liberty Bonds. This was the first time the Fed substantially monetized federal debt. Once that precedent was set, there was no going back.
Roosevelt accelerated this transformation. Within days of taking office in 1933, Executive Order 6102 required Americans to surrender their gold at $20.67 per ounce. Then the Gold Reserve Act of 1934 revalued gold to $35 per ounce, a 69% devaluation.
The Banking Act of 1935 fundamentally restructured the Fed, centralizing authority in Washington. According to the Cato Institute, this shift reduced the regional banks’ independence. While proponents argued this improved policy coordination, it also reduced the system’s ability to respond to regional economic differences.
The 1960s marked a major turning point in U.S. monetary dynamics. Federal spending rose sharply during the decade, driven by President Johnson’s Great Society programs and escalating Vietnam War costs,with total federal outlays increasing from about $92 billion in 1960 to roughly $184 billion by 1969, according to OMB historical budget data. While the decade began and ended near balance, the government ran growing mid-decade deficits, peaking at approximately $25 billion in fiscal year 1968.
On August 15, 1971, Nixon announced the “temporary” suspension of dollar convertibility into gold. That “temporary” suspension became permanent. The dollar became pure fiat currency backed by nothing except promises.
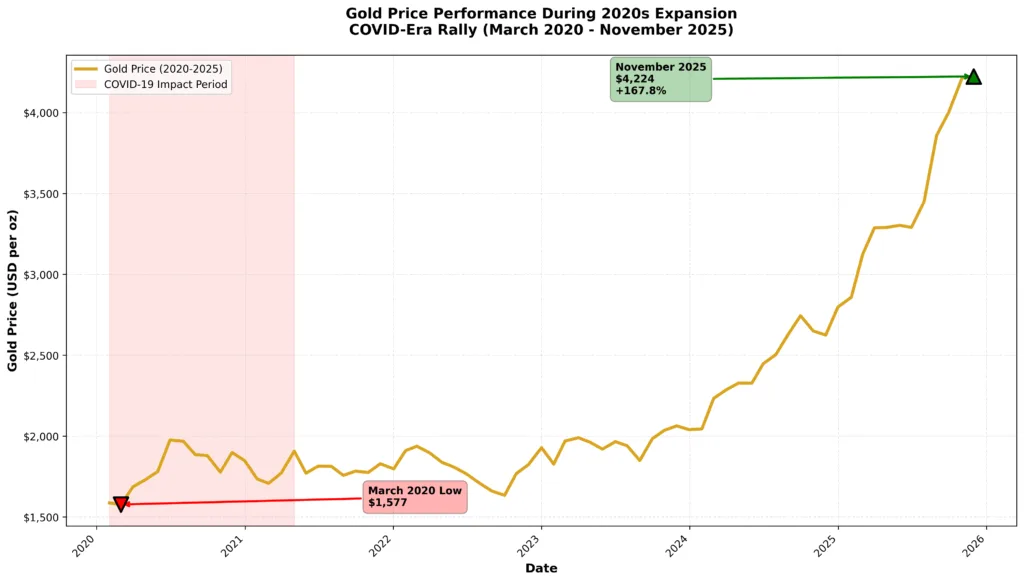
The 1970s featured persistent inflation that destroyed purchasing power while gold surged from $35 per ounce to over $850 by January 1980, a 2,300% gain.
Government Debt Replaces Gold: The Fed’s Trap
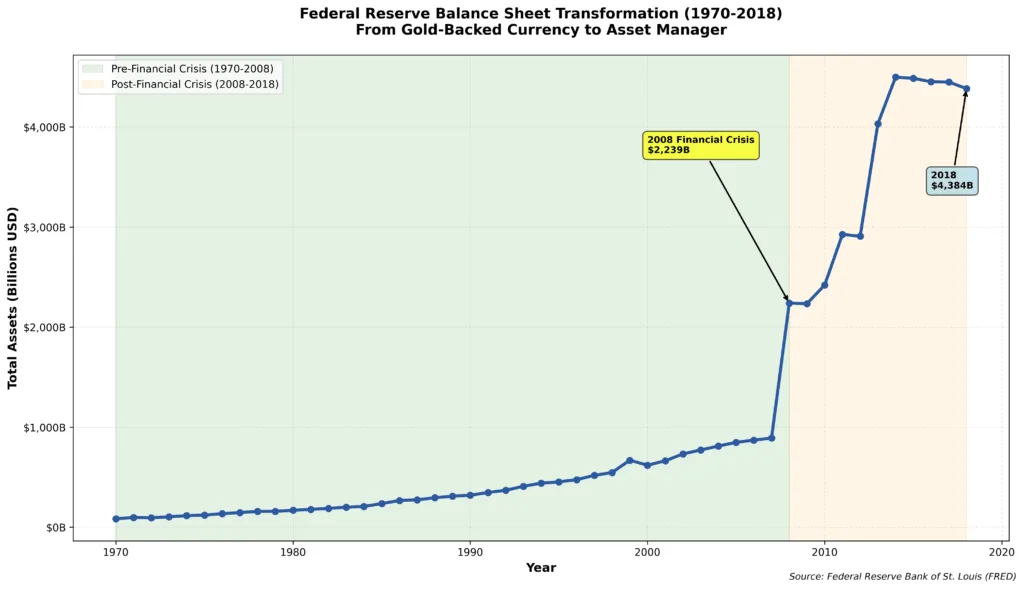
After 1971, government debt increasingly replaced gold reserves as the primary asset backing Federal Reserve operations. According to Federal Reserve balance sheet data, the composition shifted dramatically over decades. By 2024, the Fed held $4.8 trillion in Treasury securities while gold holdings (valued at market prices) represented a much smaller portion of total assets.
This means the dollar is backed by the full faith and credit of the U.S. government, including its taxing power, institutional credibility, economic output, and global reserve currency status. Critics argue this creates circular dependency: government issues debt, Fed buys it with newly created money, and the system’s stability depends on confidence in government’s fiscal capacity. Defenders counter that this flexibility allows monetary policy to respond to economic conditions in ways gold convertibility prevented.
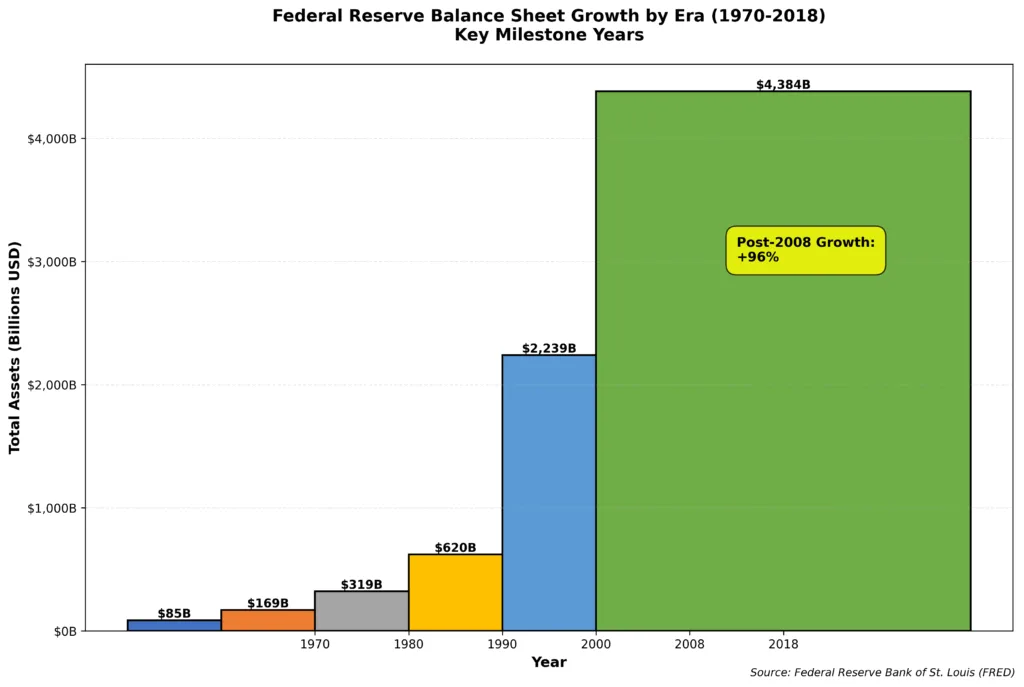
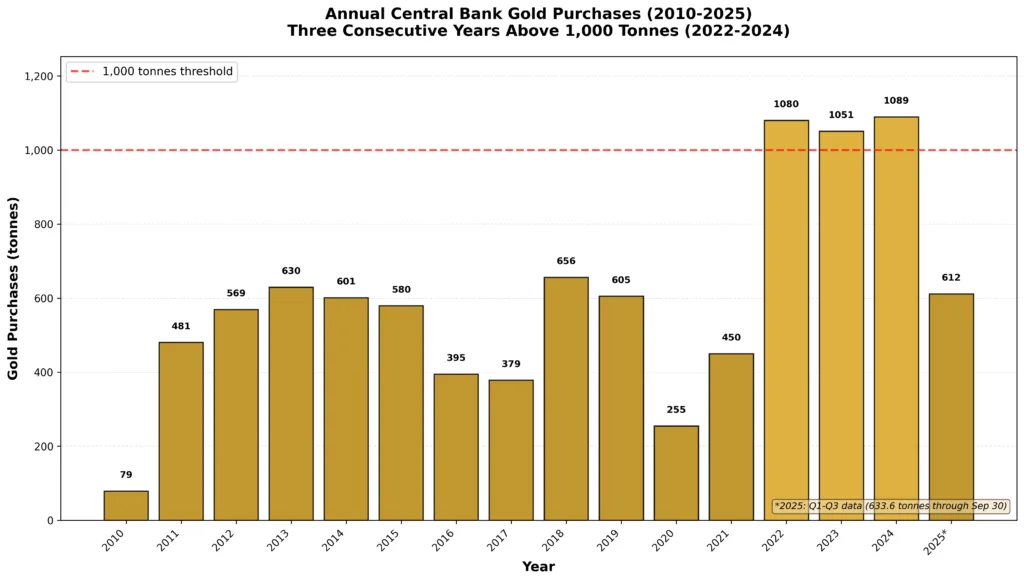
According to FRED data, the Fed’s balance sheet expanded from approximately $50 billion (1970) to over $7 trillion (2024). Central banks worldwide have been accumulating gold reserves, 1,051 tonnes in 2023 per World Gold Council data, suggesting institutional concerns about long-term currency diversification.
Federal debt increased from $398 billion (1971) to over $34 trillion (2024) per U.S. Treasury data, an 8,500% increase. The CBO projects 166% debt-to-GDP by 2054, with interest consuming 6.7% of GDP annually. According to CBO projections, debt exceeds 200% of GDP by 2050, assuming no major wars, no new programs, no recessions.
This creates what economists call “fiscal dominance”, where monetary policy becomes constrained by fiscal needs. The Fed faces difficult tradeoffs when maintaining tight money would cause debt service costs to consume larger portions of the budget. While not an absolute “trap,” these dynamics create structural pressures that favor accommodation over sustained tight money.
Why the Fed Gets Blamed for Government’s Problems
The Fed takes all the heat for inflation, but inflation starts with fiscal policy forcing monetary accommodation. Some research (including a paper from the Federal Reserve Bank of Minneapolis) argues that sustained large fiscal deficits can raise inflationary pressure, in effect limiting a central bank’s ability to fully control inflation under certain conditions.
During COVID-19, Congress ran deficits totaling $5.9 trillion in 2020-2021 according to OMB historical budget data—$3.1 trillion in 2020 and $2.8 trillion in 2021. The Fed accommodated by expanding its balance sheet from $4.2 trillion to $8.9 trillion, creating $4.7 trillion in new dollars. Inflation peaked at 9.1% in June 2022 per BLS data. The Fed facilitated it, but Congress created it.
Financial instability also traces to government debt replacing commercial paper. According to Bank for International Settlements research, credit cycles increased in amplitude since 1971. As examined in our Fed liquidity stress analysis, the banking system periodically runs short of reserves, forcing emergency interventions because self-regulating mechanisms gold provided no longer exist.
Most damaging: the shift from gold to debt eliminated external discipline on money creation. Under gold standard, excessive currency creation triggered gold outflows automatically contracting money supply. That doesn’t exist when government debt backs currency. Political will evaporates as soon as unemployment rises or markets decline.
The Structural Bull Case for Gold
Understanding the Fed’s transformation helps explain why many analysts see gold entering a structural bull market. Returning to a gold standard at current debt levels would face enormous practical challenges. According to Wharton Budget Model analysis, stabilizing debt at current levels would require either 30% spending cuts or 40% tax increases sustained for decades, politically difficult though not strictly impossible.
This leaves constrained options: default (politically unthinkable given Social Security, Medicare, and defense obligations), austerity (politically difficult), or allowing inflation to reduce debt’s real value over time. Many analysts view the third option as most likely, creating conditions that historically favor gold.
Central bank behavior supports this view. Per World Gold Council Q3 2025 data, central banks purchased 220 tonnes in Q3 2025, continuing accumulation exceeding 1,000 tonnes annually since 2022. As detailed in our who’s buying all the gold analysis, this represents three consecutive years of elevated purchases despite gold near record highs above $4,000. These purchases suggest institutional portfolio diversification away from dollar-denominated reserves.
Investment demand also accelerated, Q3 2025 reached 537 tonnes, up 47% year-over-year. Gold ETFs experienced their largest monthly inflow ever ($17 billion in September 2025), with flows continuing during October’s correction.
The Fed faces challenging policy tradeoffs. Maintaining tight policy risks recession and political pressure to ease. Easing prematurely risks persistent inflation. While gold prices fluctuate based on many factors, real interest rates, global demand, supply, geopolitical risk, and investor sentiment, these structural fiscal-monetary dynamics represent one significant tailwind among several drivers. As examined in gold bull market corrections, scenarios favoring tight monetary conditions face structural headwinds, while scenarios allowing easier policy may support gold.
The 1970s Playbook Is Repeating
Current conditions share similarities with the 1970s, when fiscal pressures constrained monetary discipline. Great Society and Vietnam War spending created deficits complicating Fed policy. Per Federal Reserve historical data, Chairman Arthur Burns tightened policy multiple times, only to ease when unemployment rose or political pressure intensified. This stop-start approach allowed inflation to persist through much of the decade.
Today shows similar patterns. The Fed raised rates to 5.25% (2022-2023), then started cutting in September 2024 despite core inflation above 3%, above their 2% target per BLS data. As explored in our CAPE ratio analysis, current valuations combined with persistent inflation and elevated debt show some parallels to the 1970s environment.
During 1970s stagflation, gold returned over 2,000%, from $35 (1971) to over $850 (January 1980). That bull market featured a 47% correction from December 1974 to August 1976 before rallying 300% from August 1976 to peak. Corrections of 15-20% within secular bull markets are historically normal. Structural drivers can persist regardless of short-term volatility.
Investment Implications
Physical gold in coins and bars provides pure exposure without counterparty risk. Popular sovereign coins like American Gold Eagles, Canadian Maple Leafs, or Austrian Philharmonics offer high liquidity with recognizable government minting.
Systematic accumulation removes timing anxiety. Making regular purchases, monthly or quarterly, captures both strength and weakness. This proved effective during previous secular bull markets. Investors who accumulated systematically throughout the 1970s, including during the 1974-1976 correction, participated fully in the subsequent 300% rally.
Per World Gold Council research, 5-15% precious metals allocations historically improved risk-adjusted returns while reducing volatility in diversified portfolios. Position sizing should provide meaningful impact if structural tailwinds continue, but not so large that volatility forces liquidation during corrections. The ability to hold through 10-20% corrections historically separated successful long-term gold investors from those who sold at disadvantageous times.
Structural bull markets in gold have historically played out over years and decades. The 1970s gold bull lasted nine years. The 2001-2011 bull lasted ten years. Investors evaluating gold’s current position should consider multi-year time horizons, recognizing that prices respond to multiple variables beyond just fiscal-monetary dynamics.
Conclusion
The Federal Reserve’s transformation from a decentralized, gold-backed system to a centralized institution with expanded government securities holdings wasn’t inevitable. It resulted from specific policy responses to crises, World War I, the Great Depression, World War II, 1960s fiscal expansion, and 1970s stagflation, each prioritizing flexibility and government financing capacity over rigid gold convertibility.
Economists debate whether these changes represented necessary adaptations to modern economic complexity or abandonments of sound money discipline. Supporters argue that gold standard rigidity contributed to the Great Depression’s severity and that fiat currency systems allow appropriate monetary responses to economic crises. Critics contend that removing gold discipline enabled unsustainable debt accumulation and persistent inflation.
What’s clear: the transformation created structural conditions where gold often performs well, elevated government debt levels, fiscal pressures constraining monetary policy, periodic inflation concerns, and loss of hard currency anchors.
While returning to a gold standard faces enormous practical obstacles given current debt levels and entitlement commitments, that doesn’t make it absolutely impossible, just highly improbable under current political and economic constraints. The more relevant question for investors: do current fiscal-monetary dynamics create structural tailwinds for gold over multi-year periods?
Whether you’re establishing initial precious metals positions or expanding existing holdings, Bullion Trading LLC offers comprehensive gold and silver products backed by market expertise and commitment to investor education. From popular sovereign coins to large institutional bars, our extensive inventory serves every investment strategy.