

Update, 21 October 2026: This analysis was written in November 2025; its prices, figures and outlook are as of that date. On 3 November 2026 the gold Ask was $3,954 an ounce and silver $49.90, 27% and 58% below the records both set on 29 January 2026. For the record and the crash that followed, see gold price in 2026.
Something critical is happening beneath the surface of financial markets that most investors aren’t paying attention to. The overnight funding markets, the essential plumbing that moves cash between banks every single night, started showing stress signals in late 2024 and early 2025. When these pipes get clogged, the entire financial system feels it immediately.
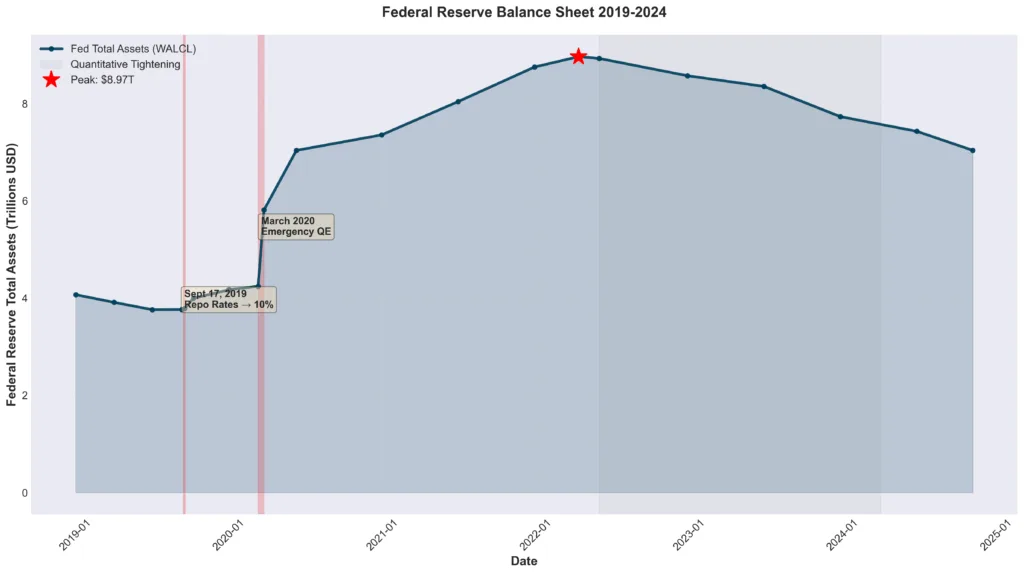
In October 2025 the Federal Reserve decided to end quantitative tightening (QT) on 1 December, pointing to tightening conditions in money markets as bank reserves fell. When banks don’t have enough liquidity, overnight markets start showing strain. We’ve seen this movie before. The exact same pattern emerged in September 2019 when repo rates spiked to 10%, forcing the Fed to intervene with emergency liquidity operations. The Fed had already stopped shrinking its balance sheet on 1 August 2019; after the spike it ran overnight repo operations and, in October 2019, began buying Treasury bills to rebuild reserves.
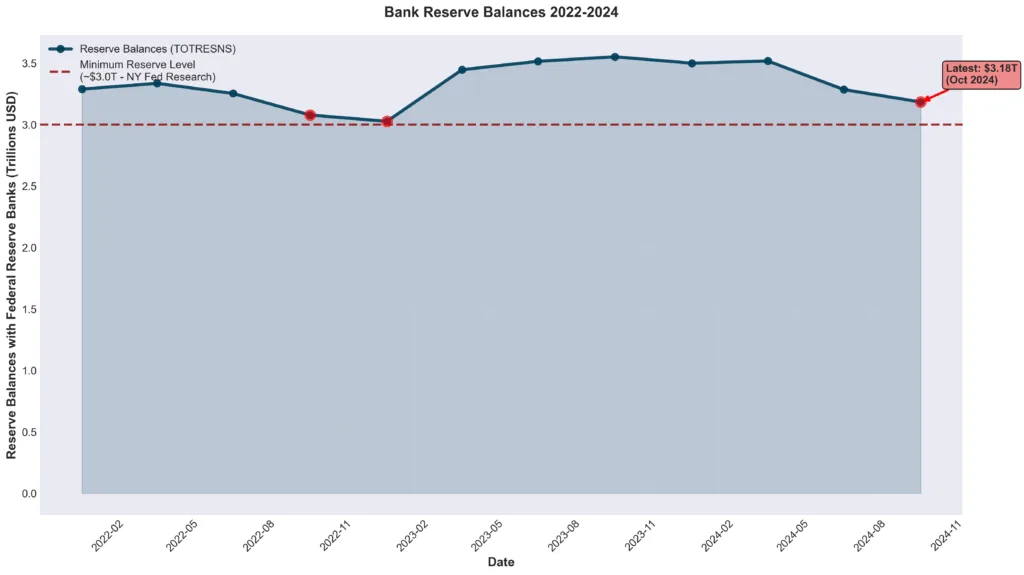
According to Federal Reserve data on bank reserves, total reserve balances have declined substantially from their pandemic peak of over $4 trillion to approximately $3.4 trillion by late 2024. This matters because research from the Federal Reserve Bank of New York suggests the banking system requires approximately $3 trillion in reserves to function smoothly without stress. We’re approaching that threshold again.
Even after the Fed officially stopped QT, funding conditions remained strained. Banks began using the Fed’s Standing Repo Facility (SRF) and discount window more frequently, clear signs that the system is running short on cash. The Federal Reserve’s H.4.1 statistical release shows elevated usage of these emergency lending facilities throughout late 2024 and into 2025.
Why the Fed Stopped QT: It Wasn’t Optional
In the author’s reading, the Fed ended quantitative tightening not because inflation was beaten or the economy was strong, but because funding markets were showing strain; the Fed itself pointed to tightening money market conditions.
As detailed in our analysis of gold as a liquidity crisis indicator, when overnight funding markets tighten, it reveals that bank reserves have fallen below comfortable levels. Banks become reluctant to lend to each other, hoarding liquidity for their own needs. This hoarding behavior creates a vicious cycle where liquidity tightens further.
Goldman Sachs research from late 2024 projected that the Fed would need to begin quietly growing its balance sheet again through what they call “reserve management purchases.” Critics call this quantitative easing by another name; the Fed describes such purchases as technical operations to keep reserves ample, not a change in its policy stance. Either way, the Fed would be buying Treasury bills to add reserves to the banking system.
The 2019 Playbook Repeats
The September 2019 repo crisis provides the clearest template for understanding current conditions. Overnight repo rates, which typically trade close to the Fed’s policy rate, suddenly spiked to 10% on September 17, 2019. According to Federal Reserve research on the 2019 repo spike, the crisis emerged when reserve levels fell below the threshold needed for smooth market functioning.
The Fed responded immediately with emergency repo operations, injecting hundreds of billions in liquidity. Within weeks, in October 2019, it began buying Treasury bills, though it avoided calling the purchases QE. The author sees the same sequence in 2025: QT pushed reserves too low → funding stress emerged → the Fed reversed course with balance sheet expansion.
What Reserve Management Really Means for Gold
When the Fed expands its balance sheet through reserve management purchases or any other mechanism, it creates more dollars. Gold bulls argue that more dollars chasing the same goods means each dollar buys less.
They also see a more immediate effect on gold: balance sheet expansion increases bank reserves, which they argue lowers the dollar’s value relative to hard assets. As examined in our analysis of Fed rate cuts and gold prices, gold doesn’t wait for formal announcements of stimulus. It reacts to stress happening behind the scenes in the financial system’s plumbing.
In their view, the sequence works like this:
- Banking system runs low on liquidity → Reserve balances fall below comfort levels
- Overnight funding markets show stress → Banks increase emergency borrowing
- Fed forced to add reserves → Balance sheet expansion through Treasury purchases
- Dollar foundation weakens → More currency units outstanding relative to economic activity
- Gold appreciates → Fixed supply becomes more valuable relative to expanding currency
According to World Gold Council Q3 2025 data, gold demand reached 1,313 tonnes in Q3 2025 despite prices trading near all-time highs. As detailed in our Q3 demand analysis, central banks purchased 219.9 tonnes in Q3 alone, up 28% from Q2. In the World Gold Council’s surveys, central banks give reasons such as diversification and gold’s performance in crises; the surveys do not single out Fed liquidity.
The Standing Repo Facility: The Quiet Alarm
The Fed established the Standing Repo Facility (SRF) in July 2021 as a permanent backstop for overnight funding markets. Think of it as an emergency lending window where banks can borrow cash overnight using Treasury securities as collateral. Banks pay a penalty rate, currently 10 basis points above the Fed’s policy rate, to access this facility.
Usage of the SRF remained minimal throughout 2022 and most of 2023. But Federal Reserve statistical releases show increased SRF usage beginning in late 2024. This matters enormously because banks only use penalty-rate facilities when they can’t obtain funding through normal channels at better rates.
Rising SRF usage signals that overnight funding markets are tight. When funding is abundant, no bank would pay a penalty rate. They’d simply borrow from other banks at standard rates or use excess reserves. Elevated SRF usage tells you the system is running short on cash.
Why Gold Bulls Saw This Environment as Favorable
Gold bulls argue that gold tends to move while financial stress is building, before stimulus is announced, so that by the time the Fed announces a program much of the move is already priced in.
In their view, the environment in late 2025 had these features:
1. Forced Balance Sheet Expansion
Unlike discretionary QE programs launched to stimulate growth, reserve management purchases occur because the system requires them. The Fed isn’t choosing to expand the balance sheet, they’re being forced to by liquidity dynamics. The argument is that forced interventions tend to be larger and longer-lasting than discretionary stimulus.
2. Weakening Dollar Foundation
More liquidity equals a bigger Fed balance sheet, which equals more dollars relative to economic output. According to Federal Reserve economic data, M2 money supply has expanded substantially since 2020, even accounting for the 2022-2023 decline during QT. Balance sheet re-expansion will resume this trend.
Gold bulls argue that a larger monetary base relative to real activity erodes a currency’s purchasing power over time, and that gold, whose supply grows only about 1.5% a year from mining, gains relative to it. The link is loose in practice: the Fed’s balance sheet grew sharply from 2008 to 2014, yet gold fell about 45% from 2011 to 2015.
3. Persistent Inflation Pressures
The Fed ended QT despite inflation remaining above their 2% target. According to Bureau of Labor Statistics CPI data, core inflation has proven remarkably sticky, consistently running above 3% through much of 2024 and into 2025. The Fed’s tolerance for above-target inflation combined with forced balance sheet expansion is a combination that gold bulls compare with the 1970s and 2000s, when gold rose strongly.
As examined in our analysis of U.S. household debt crisis, the author sees parallels with 1970s stagflation: slowing growth, persistent inflation, and mounting debt levels that encourage inflationary monetary policy.
4. Central Bank Accumulation
Central banks purchased approximately 634 tonnes of gold through Q3 2025 according to World Gold Council preliminary data. This buying continues at elevated levels despite gold trading near record prices above $4,000 per ounce. Analysts often read their sustained buying at high prices as a judgment about long-term currency risk.
Central banks’ reasons, reserve diversification and sanctions risk among them, are not the same as an individual saver’s, and their buying does not by itself make gold cheap or expensive at a given price.
The Policy Box Argument
Gold bulls describe the Fed’s choices as a dilemma in which both paths support gold:
Scenario 1: Maintain Tight Policy
- Banking system runs out of reserves
- Funding markets seize up
- Credit crunch threatens real economy
- Fed forced to add liquidity anyway
- Outcome: Balance sheet expansion → Gold positive
Scenario 2: Ease Policy Proactively
- Lower rates and expand balance sheet
- Inflation persists or re-accelerates
- Dollar weakens from monetary expansion
- Outcome: Currency debasement → Gold positive
As detailed in our analysis of gold bull market corrections, proponents see an asymmetry: they expect the Fed to head off deflation and a much stronger dollar, which leaves inflation and dollar weakness as the likelier risks. Real yields and the dollar both rose sharply in 2022, and gold fell about 20% between March and late September that year, so the argument depends on the Fed’s future choices.
The U.S. national debt exceeding $38 trillion, approximately 125% of GDP, further constrains Fed options. High debt levels make sustained tight monetary policy economically unsustainable due to debt service costs. The government paid over $1.2 trillion in interest in fiscal year 2024, approaching 20% of total federal revenue.
Proponents argue that these debt dynamics bias policy toward lower rates and more money over time, which they see as supportive for gold.
How Gold Bulls Apply This Argument
Investors who follow this argument draw a few conclusions, each with caveats:
Volatility and Weakness
Gold experienced notable intraday volatility during late 2024 and early 2025, with some sessions showing 3-5% price swings. Market commentary often interprets this as gold weakness. But as we examined in our liquidity crisis indicator analysis, gold’s volatility during funding market stress has often come before larger gains.
On this reading, the volatility reflects gold’s role as a liquid asset that institutions sell when they need cash quickly during stress, not a problem with gold. Some investors buy into such selling; it can also last longer than expected.
Focus on Structural Drivers
Proponents argue that each sign of liquidity stress adds to the case for gold:
- Banking system requires Fed intervention
- Intervention involves balance sheet expansion
- Expansion increases money supply
- Increased supply relative to fixed gold supply supports appreciation
Short-term price moves driven by technical factors, options expiration, month-end rebalancing, create noise around this structural signal.
Physical Ownership and Counterparty Risk
Physical gold held directly carries no counterparty risk: its value does not depend on any institution’s solvency, although its price still moves with the market. As explored in our gold vs. real estate analysis, supporters see this as most valuable during financial system uncertainty.
Historical Precedent: 2019 Repo Crisis Aftermath
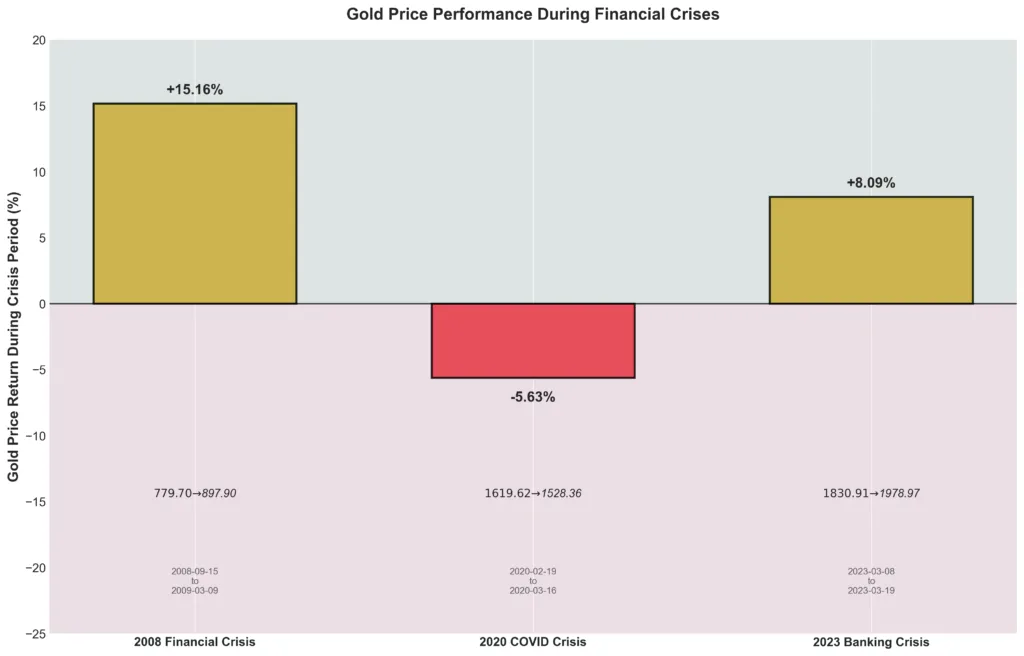
The September 2019 repo crisis provides the cleanest historical precedent for current conditions. After repo rates spiked to 10%, the Fed initially conducted temporary repo operations. But by October 2019, they announced a program to purchase $60 billion monthly in Treasury bills to expand the balance sheet.
Gold’s response proved instructive. From September 2019 through August 2020, gold rallied from approximately $1,470 per ounce to over $2,060, a gain exceeding 40%. The rally accelerated in March 2020 when the COVID crisis forced even more aggressive Fed intervention, but the foundation was established when the 2019 liquidity stress revealed the Fed’s commitment to maintaining abundant reserves.
The author argues that late 2025 followed the same sequence: QT pushed reserves too low, funding stress emerged, and the Fed would respond with balance sheet expansion, with gold weakness during the stress phase giving way to gains during the policy response. One precedent is a thin basis for a forecast.
How Investors Hold Gold
Investors who act on this view use a few common approaches:
Physical Coins and Bars
Physical gold in coins and bars held directly carries no counterparty risk. Sovereign coins such as American Gold Eagles, Canadian Gold Maples and Austrian Philharmonics are recognized by dealers worldwide; larger bars usually carry lower premiums per ounce.
Regular Purchases
Some buy a fixed amount at regular intervals (dollar-cost averaging) instead of trying to time the market. It spreads purchases across high and low prices but does not prevent losses if prices fall.
Position Size
Allocation figures quoted in the industry vary widely; how much to hold, if any, depends on individual circumstances, and this article does not recommend a percentage. Gold has had 10-20% corrections within bull markets and fell about 45% from 2011 to 2015, so holders generally size positions so that such falls would not force a sale.
Silver
Silver tends to move more than gold in both directions and has large industrial demand. The gold-silver ratio is the usual way to compare the two metals’ prices.
Conclusion: Liquidity Signals and Gold
In late 2025, overnight funding markets were signaling that bank reserves had fallen toward the lower end of what the Fed considers ample. The decision to end QT, alongside more use of the Standing Repo Facility, showed the Fed responding.
Gold bulls expect reserve management purchases, which they see as quantitative easing by another name, to expand the Fed’s balance sheet while gold’s supply grows only slowly, and they argue that this has supported gold in the past. The relationship has not been consistent: gold fell from 2011 to 2015 while the balance sheet grew.
In the author’s view, the Fed ended QT because funding markets needed it, not because inflation was beaten. Gold bulls see balance sheet expansion despite above-target inflation as favorable for gold; that is an argument about the future, not a guarantee.
Bullion Trading LLC sells gold and silver coins and bars, from sovereign coins to large bars, online and at its New York store. This article is not investment advice.