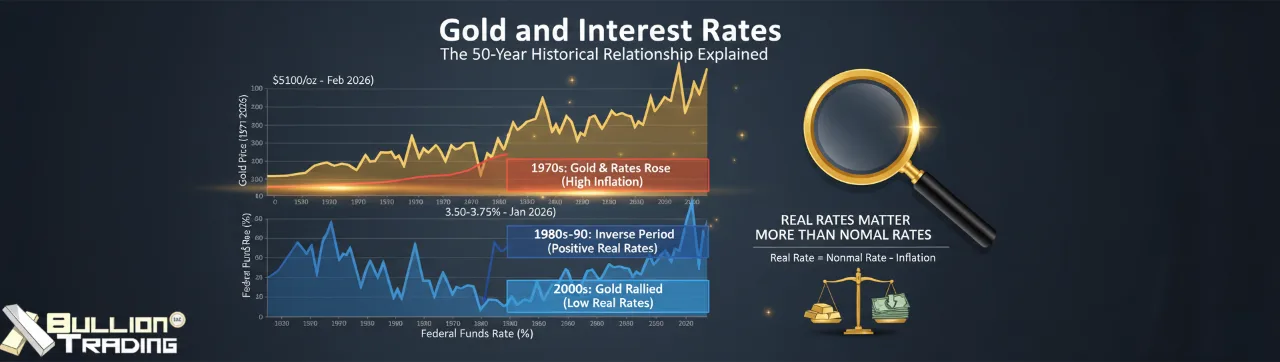
Gold is trading above $5,100 per ounce in February 2026, and the Federal Reserve just held rates steady at 3.50-3.75% during its January 28, 2026 meeting. If you’ve spent any time reading about precious metals, you’ve probably heard the conventional wisdom: when interest rates go up, gold goes down. It sounds logical. It feels intuitive. And over the past five decades, it has been wrong just as often as it has been right.
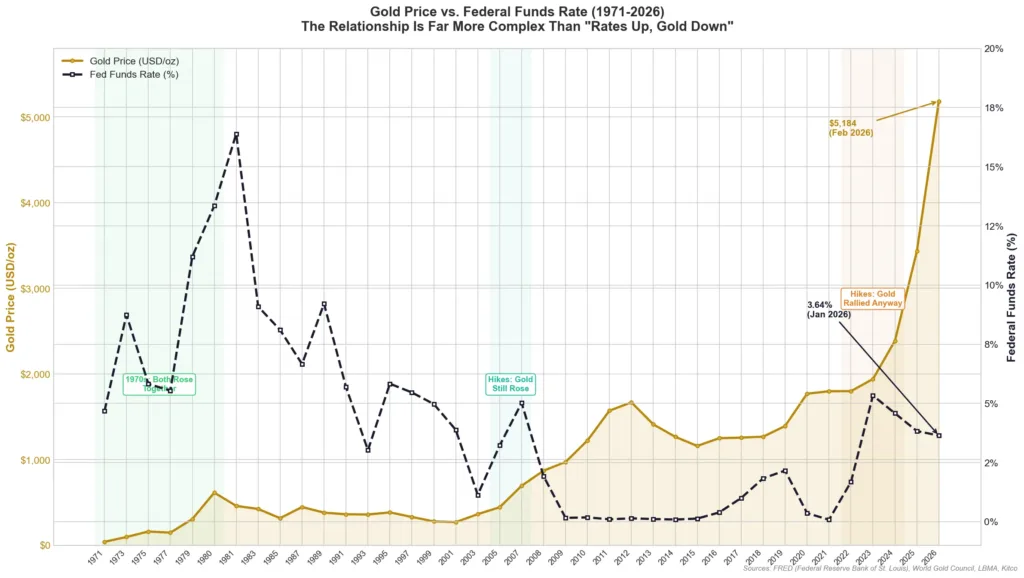
The relationship between gold and interest rates is one of the most discussed topics in investing, and one of the most misunderstood. Looking at over 50 years of price data reveals something that surprises many investors: the correlation between interest rates and gold prices since 1970 is only about 28%, which is not statistically significant. That means the simple “rates up, gold down” narrative misses a much bigger picture.
Let’s walk through the actual history.
The 1970s: Gold and Rates Rose Together
The modern gold market began in August 1971, when President Richard Nixon ended the dollar’s convertibility to gold at $35 per ounce. What followed over the next decade demolished the idea that rising interest rates automatically hurt gold.
From 1971 to 1980, gold surged from $35 to a peak of roughly $850 per ounce. During that exact same period, short-term interest rates climbed from around 3.5% to over 16% as Federal Reserve Chairman Paul Volcker launched his aggressive campaign to crush double-digit inflation. Gold and interest rates moved in the same direction for nearly a full decade. The reason was straightforward: inflation was running so hot (peaking above 14% in 1980) that even 16% interest rates produced negative real returns after accounting for the loss of purchasing power. Investors weren’t looking at the nominal rate on a Treasury bill; they were looking at what that rate actually earned them after inflation ate into it. And in that environment, gold looked far more attractive than a bond yielding 12% while inflation ran at 14%.
This decade alone should give pause to anyone who treats the gold-rates relationship as a simple inverse formula. The largest bull market in gold’s modern history happened while interest rates were climbing to their highest levels in American history.
The 1980s and 1990s: A Genuine Inverse Period
After Volcker’s rate hikes finally broke inflation’s back, both interest rates and gold entered a long decline. The federal funds rate gradually fell from its early-1980s peaks down to around 3% by the early 1990s, and gold drifted lower too, eventually bottoming near $253 per ounce in August 1999.
But here’s the thing: this wasn’t really an inverse correlation at work. Gold fell during these decades not because rates were coming down, but because real interest rates were strongly positive. Inflation dropped faster than nominal rates did, so savers could actually earn meaningful returns by holding Treasury bonds or certificates of deposit. The opportunity cost of holding gold, which pays no interest or dividends, became very real. When a 10-year Treasury bond yields 6% and inflation is running at 3%, that’s a genuine 3% real return. Gold has a hard time competing with that.
Meanwhile, the dollar strengthened considerably through this period, central banks were net sellers of gold (the United Kingdom famously sold half its reserves between 1999 and 2002 at rock-bottom prices), and investor sentiment toward the metal turned deeply negative. The rate environment contributed to gold’s decline, but it was one factor among many.
Why Real Interest Rates Matter More Than Nominal Rates
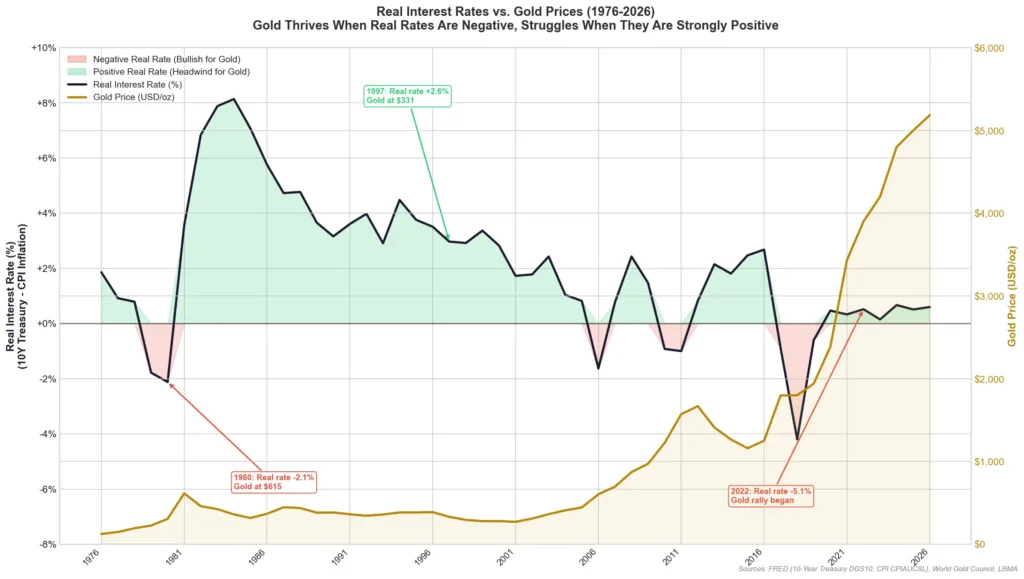
This is the piece that the simplistic “rates up, gold down” framework completely misses. What actually drives gold’s relationship with interest rates is not the nominal federal funds rate or the yield printed on a Treasury bond. It’s the real interest rate: the nominal rate minus the rate of inflation.
The concept is practical, not academic. If a savings account pays 5% interest but inflation is running at 6%, you are losing purchasing power every year you hold that deposit. In that scenario, the real interest rate is -1%, and suddenly an asset like gold, which holds its purchasing power over long periods but pays no yield, starts looking like the smarter choice. Research from the World Gold Council consistently shows this pattern across decades. Gold tends to deliver its strongest performance during periods of negative or low real interest rates, and it struggles most when real rates are meaningfully positive. The 1970s had deeply negative real rates and gold boomed. The mid-1990s had strongly positive real rates and gold languished. The relationship is not perfect, nothing in markets ever is, but it is far more consistent than the connection between gold and nominal rates alone.
The 2000s and 2010s: Gold’s Great Bull Run
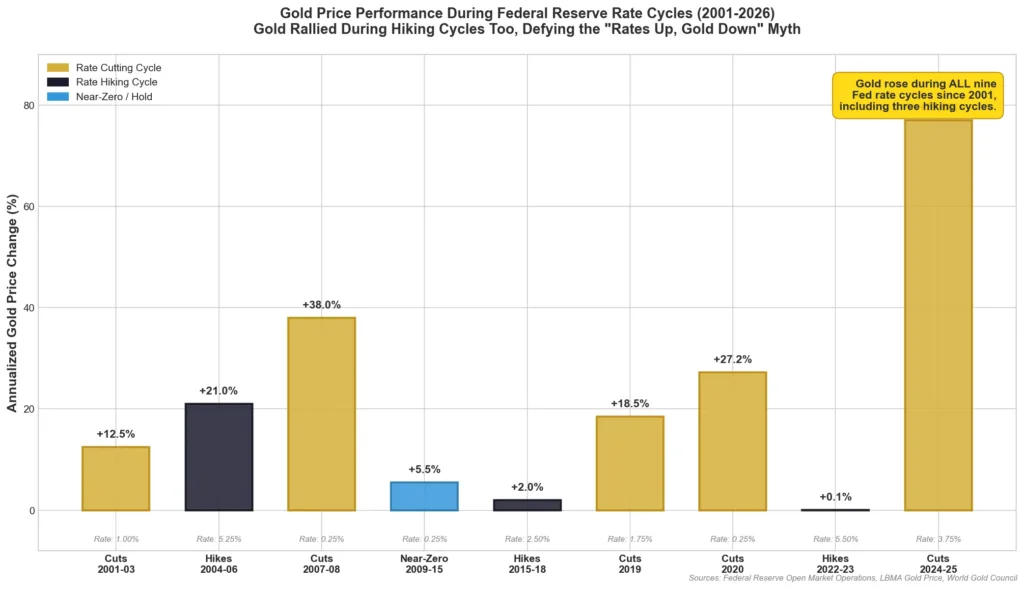
The 2001-2011 period provides another powerful case study. Gold rose from approximately $260 per ounce in early 2001 to $1,921 in September 2011, a gain of more than 600%. During this period, the Federal Reserve cut the federal funds rate from 6.50% to 1.00% between 2001 and 2003, then raised it back to 5.25% by 2006, then slashed it to effectively zero during the 2008 financial crisis.
Gold rose during the rate cuts of 2001-2003. It rose during the rate hikes of 2004-2006. It rose during the emergency cuts of 2007-2008. And it continued rising through the zero-rate environment of 2009-2011. The Fed’s own records show these dramatic swings, and gold largely ignored them, climbing through both tightening and easing cycles.
What did gold respond to? Real interest rates were persistently low or negative through much of this period. The dollar was weakening. Governments were running large fiscal deficits. Central banks in emerging markets, particularly China and Russia, were steadily building gold reserves. And the 2008 financial crisis created a massive flight to safety that overwhelmed any effect from rate changes.
Then came 2013, when the Fed signaled it might begin tapering its quantitative easing program. Gold dropped sharply, falling from around $1,700 to below $1,200 by the end of the year. This was the famous “taper tantrum”, and it was driven less by actual rate changes (rates were still near zero) than by the expectation that rates would eventually normalize and real yields would turn positive.
2020-2026: The Most Recent Chapter
The COVID-19 pandemic pushed the Federal Reserve to slash rates to 0-0.25% in March 2020, and gold responded by reaching what was then a record high of $2,075 per ounce in August 2020. Massive fiscal spending, combined with zero rates, created deeply negative real interest rates, and gold thrived.
When inflation surged in 2022 and the Fed launched its most aggressive hiking cycle in four decades, raising rates from near-zero to 5.25-5.50% by July 2023, gold did initially decline. Prices fell from about $2,050 in March 2022 to around $1,630 by September-November 2022 as the prospect of meaningfully positive real yields drew capital toward fixed-income investments.
But then something unexpected happened. Even as the Fed held rates at 5.25-5.50% through most of 2023 and the first half of 2024, gold began climbing again. By late 2024, gold had broken through $2,700, and the LBMA gold price averaged $2,386 per ounce for the full year 2024, a 23% increase over 2023’s average. That rally occurred while real rates were arguably positive, meaning the traditional framework would have predicted weakness, not strength.
What Broke the Old Playbook?
The gold rally of 2023-2026 exposed the limitations of interest-rate-focused analysis. Several forces combined to push gold higher even while rates remained elevated.
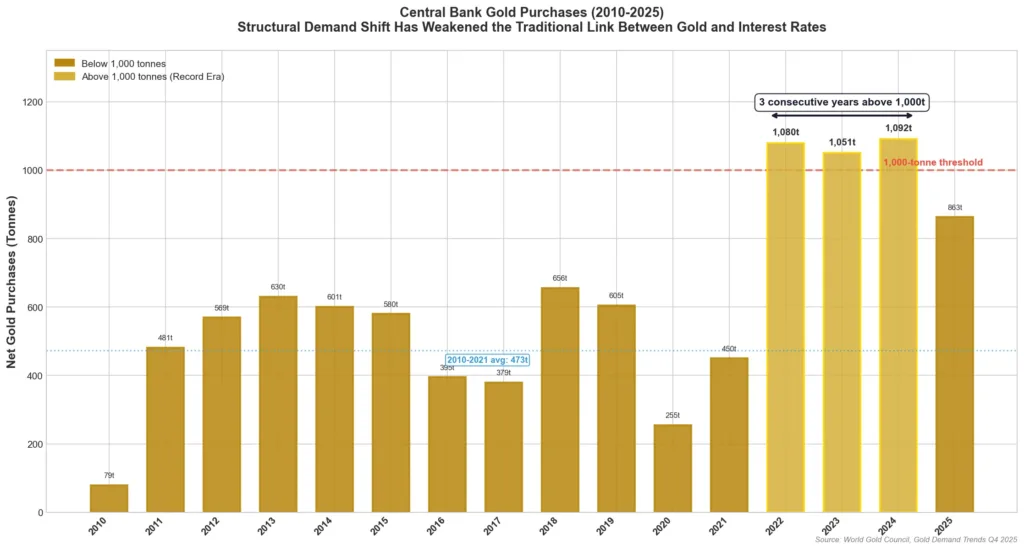
Central bank buying has been the most powerful driver. According to the World Gold Council’s Gold Demand Trends report, central banks purchased over 1,000 tonnes of gold for the third consecutive year in 2024, with buying accelerating sharply in Q4 to 333 tonnes. Total global gold demand hit a record 4,974 tonnes. This institutional buying, driven by diversification away from U.S. dollar reserves, geopolitical hedging, and de-dollarization trends, is largely insensitive to interest rate movements.
Geopolitical risk has also played a growing role. The freezing of Russian central bank assets in 2022 prompted many nations to reconsider the safety of holding reserves in Western currencies, and that shift accelerated gold purchases by countries seeking sanctions-proof assets.
Then came the Federal Reserve’s easing cycle. The Fed cut rates three times in 2024 (September, November, December), bringing the target down to 4.25-4.50%. In 2025, three more cuts followed (September, October, December), reducing the rate further to 3.50-3.75%. At its January 2026 meeting, the FOMC held steady, with the statement noting that “inflation remains somewhat elevated” while “economic activity has been expanding at a solid pace”.
With each step down in rates, gold found fresh momentum. Gold spot prices climbed past $4,000, then $5,000, and as of February 25, 2026, the metal is trading around $5,184 per ounce. That represents a gain of roughly 117% from its 2024 annual average.
A More Complete Framework for Understanding Gold and Rates
After reviewing 50 years of data, a more nuanced picture emerges. Interest rates do matter for gold, but they are just one variable in a complex equation. A more complete framework considers several factors working together.
Real interest rates, not nominal rates, provide the more relevant signal. When real rates are negative (meaning inflation exceeds the yield on safe assets), gold tends to outperform. When real rates are strongly positive, gold faces headwinds from the opportunity cost of holding a non-yielding asset.
The U.S. dollar’s strength or weakness plays a major role. Since gold is priced in dollars globally, a weaker dollar makes gold cheaper for international buyers and tends to support prices. A strong dollar creates the opposite effect.
Central bank demand has become a structural force. With emerging market central banks consistently buying at levels above 1,000 tonnes per year, the floor under gold prices has risen significantly, partially insulating the metal from rate-driven selling.
And finally, investor sentiment and positioning around expected future rate moves often matters more than the current level of rates. Gold frequently prices in anticipated policy shifts well before the Fed actually acts.
What This Means for Investors Today
With the federal funds rate at 3.50-3.75% and gold above $5,000, today’s market reflects a period where multiple bullish forces are operating at once. The World Gold Council’s Gold Outlook noted that gold’s performance depends on “rates, risk and growth”, and that uncertainty around trade policy and inflation keeps gold’s safe-haven appeal elevated.
For investors navigating this environment, the 50-year historical record offers one clear lesson: do not rely on a single variable to predict gold’s direction. The relationship between gold and interest rates is real, but it is conditional, often overshadowed by inflation dynamics, currency moves, and structural shifts in global demand.