The gold market delivered a dramatic performance in October 2025, with prices surging to unprecedented all-time highs above $4,350 per ounce before experiencing one of the sharpest single-day declines in over a decade. For investors watching their portfolios fluctuate, this volatility might seem alarming. However, a closer examination of the underlying market dynamics reveals a more nuanced story, one where temporary corrections don’t necessarily signal the end of gold’s historic bull run.
Understanding what drives these price movements and distinguishing between short-term noise and long-term trends becomes crucial for investors navigating today’s precious metals market. The recent pullback, while significant, emerges from a well-established pattern following rapid price appreciation, and the fundamental drivers supporting gold remain firmly intact.
Gold’s Record-Breaking Rally: The Context Behind the Correction
To understand the recent correction, we must first appreciate the extraordinary rally that preceded it. Throughout 2025, gold has been on a historic tear, with the World Gold Council noting that gold had reached its 39th new high for the year by late September, with year-to-date gains exceeding 60%, marking the highest return in a calendar year since 1979.
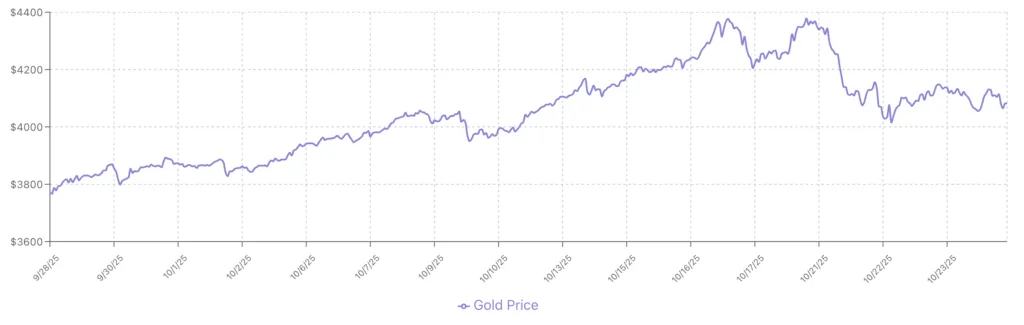
This rally wasn’t driven by speculation or market hype. Instead, it reflected profound shifts in global monetary policy, persistent inflation concerns, and unprecedented central bank gold purchases. According to Kitco News, gold broke through the psychologically significant $4,000 level multiple times in October, reaching a record peak of $4,355 per ounce on Monday, October 21st, as consumer sentiment data showed continued economic uncertainty.
The speed and magnitude of this ascent set the stage for what technical analysts call a “consolidation phase”, a natural and healthy pause where profit-taking occurs and the market digests recent gains.
The Sharp Pullback: What Actually Happened
In late October 2025, gold experienced its largest single-day decline in more than ten years. Prices dropped sharply from the record high of $4,355 to test support levels around $4,000 per ounce, representing approximately an 8% decline in a matter of hours. Market analysts described the move as “violent,” with trading volumes surging as positions were liquidated.
Several technical and market factors converged to trigger this correction:
Overbought Technical Conditions
After nine consecutive weeks of gains, gold had reached extreme overbought levels on multiple technical indicators. Relative Strength Index (RSI) readings pushed into territory historically associated with short-term reversals. As previous market analysis has shown, when assets deviate significantly from their 200-day moving average, corrections become increasingly probable.
Gold was trading more than 30% above its 200-day moving average, a level that historically precedes pullbacks. This doesn’t indicate fundamental weakness, rather, it suggests the market simply moved too far, too fast, and needed time to establish a more sustainable base.
Profit-Taking After Record Gains
Investors who purchased gold earlier in 2025 or in previous years were sitting on substantial gains. Many chose to lock in profits at record highs, creating selling pressure. This profit-taking wasn’t concentrated among retail investors alone; institutional players also adjusted positions to rebalance portfolios after gold’s outsized performance relative to other asset classes.
Strengthening Dollar and Changing Risk Sentiment
The U.S. dollar index experienced a brief but notable rally, putting pressure on dollar-denominated gold prices. Additionally, equity markets showed renewed strength, temporarily reducing the safe-haven demand that had supported gold’s ascent. News that U.S.-China trade negotiations might be progressing also boosted risk appetite, pulling capital away from defensive assets.
Why This Correction Doesn’t Change the Long-Term Picture
While the magnitude of the decline caught many investors by surprise, experienced precious metals analysts emphasize that this type of volatility is entirely normal following such a powerful rally. More importantly, the fundamental drivers that propelled gold to record highs remain not just intact, but arguably stronger than ever.
Persistent Inflation and Currency Concerns
Despite central banks’ efforts to control inflation, price pressures remain elevated across major economies. The U.S. Consumer Price Index continues to show inflation well above the Federal Reserve’s 2% target, while many consumers experience even higher rates in essential categories like food, housing, and energy.
Gold’s traditional role as an inflation hedge becomes increasingly relevant as purchasing power erosion concerns persist. Unlike fiat currencies that can be printed in unlimited quantities, gold’s supply remains constrained, with annual mine production representing only about 1.5% of existing above-ground stocks.
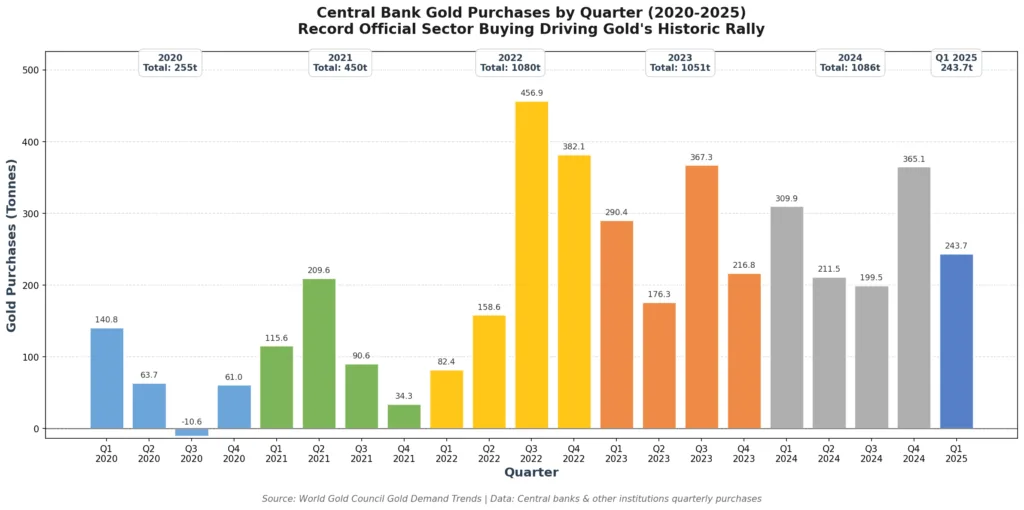
Unprecedented Central Bank Demand
Perhaps the most significant structural support for gold comes from central banks worldwide. The World Gold Council’s quarterly reports show central bank gold purchases reached record levels in recent years, with 2024 marking another banner year for official sector buying.
This buying isn’t temporary or speculative, it represents a fundamental shift in how central banks view gold in their reserve portfolios. Countries are diversifying away from dollar-heavy reserves, driven by concerns about currency weaponization, geopolitical tensions, and the long-term value of fiat currencies amid unprecedented debt levels.
Unlike retail investors who might sell during corrections, central banks tend to be patient, strategic buyers who view gold as a long-term store of value. This creates a persistent bid under the market that provides support during pullbacks.
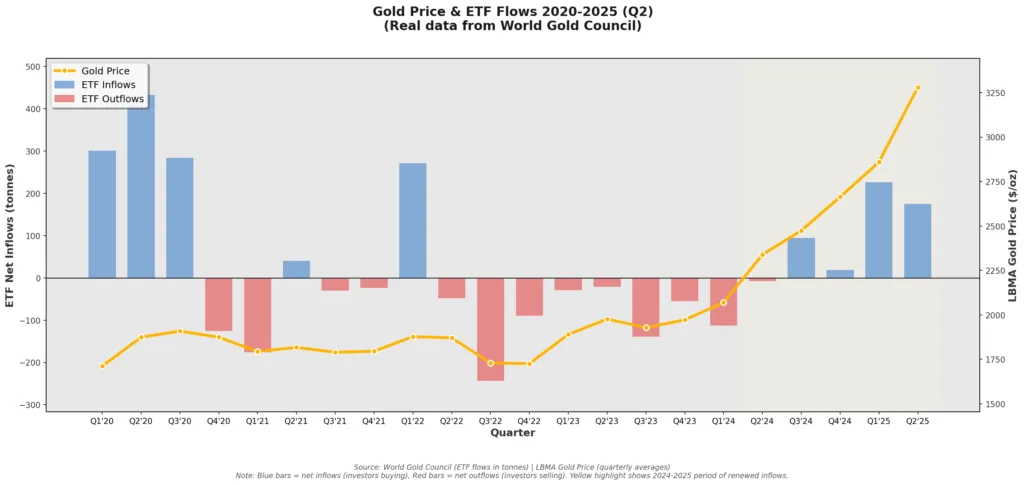
Growing Investment Demand via ETFs
The World Gold Council reported that gold-backed exchange-traded products experienced their largest monthly inflow ever in September 2025, totaling $17 billion. North American funds led with $10.6 billion in inflows, followed by European funds at $4.4 billion, and Asian funds at $2.1 billion.
This dramatic surge in ETF investment reflects growing recognition among institutional and retail investors that gold deserves a place in diversified portfolios. As traditional 60/40 stock-bond portfolios face challenges from simultaneous equity and fixed-income volatility, gold’s negative or low correlation with other major asset classes makes it an attractive diversification tool.
Importantly, during the recent correction, ETF holdings remained stable, suggesting that long-term investors are using weakness as an opportunity to add to positions rather than fleeing the market.
Fiscal Concerns and Debt Dynamics
U.S. national debt recently surpassed $38 trillion, with no credible plan to address the structural deficit. Interest payments on this debt now exceed $1 trillion annually, consuming an ever-larger share of federal revenue. These dynamics create persistent concerns about long-term dollar strength and the sustainability of current fiscal policies.
Gold historically performs well when confidence in fiscal management wanes. As analysis of Fed policy and dollar dynamics shows, the relationship between monetary policy, debt levels, and gold prices remains tightly linked.
The Technical Picture: Consolidation, Not Collapse
From a technical analysis perspective, experienced chartists view the current pullback as a healthy consolidation rather than a trend reversal. Several key indicators support this interpretation:
Support Levels Holding
Gold found critical support near $4,000 per ounce, a psychologically significant level that represents a key technical threshold. This represents a textbook technical pattern where major round numbers act as support after breakouts to new highs.
The fact that gold held firm at $4,000 and quickly rebounded to trade around $4,100 suggests strong underlying demand. Buyers emerged at these levels, preventing further deterioration and suggesting that the market views prices at or below $4,000 as attractive entry points. As of late October, gold was trading around $4,112 per ounce, demonstrating resilience despite the sharp selloff.
Long-Term Trend Remains Intact
Despite the sharp pullback, gold’s longer-term uptrend remains firmly established. The metal is still up more than 60% for 2025 and trades well above its 50-week and 200-week moving averages. Technical analysts note that bull markets rarely move in straight lines, corrections of 8-10% are common and healthy, allowing markets to digest gains and attract new buyers at more attractive levels.
Positive Seasonal Factors Ahead
Gold tends to show seasonal strength in the fourth quarter, driven by jewelry demand ahead of major festivals in India and China, as well as year-end portfolio positioning by institutional investors. This seasonal pattern, combined with the technical consolidation, could set the stage for another leg higher into year-end and early 2026.
What Investors Should Consider Now
For investors trying to navigate the current market environment, several considerations emerge from the recent volatility:
Perspective on Volatility
Volatility cuts both ways. While sharp declines can be unnerving, they also create opportunities for investors who missed earlier entry points or want to add to existing positions. As research into precious metals markets demonstrates, successful long-term investors focus on fundamentals rather than short-term price swings.
The Case for Dollar-Cost Averaging
Rather than trying to time the perfect entry or exit, many investors find success with dollar-cost averaging, making regular purchases regardless of short-term price movements. This approach removes emotion from the equation and ensures exposure to gold’s long-term appreciation potential without the stress of market timing.
During periods of elevated volatility like October 2025, dollar-cost averaging can be particularly effective, allowing investors to buy more metal when prices dip while automatically taking smaller positions when prices are elevated.
Diversification Across Forms
Investors holding physical gold, whether gold bars, coins, or other forms, often fare better psychologically during volatile periods. Unlike paper investments where balance fluctuations are highly visible, physical gold owners can focus on the tangible value they hold rather than daily price swings.
That said, a combination of physical holdings and gold ETFs can provide both the security of direct ownership and the liquidity of exchange-traded instruments. Many sophisticated investors maintain core physical positions supplemented by ETF holdings for tactical adjustments.
Understanding Individual Time Horizons
For investors with shorter time horizons who need to access capital within 1-2 years, the current volatility may warrant caution. However, for those with 3-5 year or longer investment horizons, the fundamental case for gold remains compelling despite short-term price fluctuations.
Historical analysis shows that gold corrections, even sharp ones, typically represent temporary setbacks within longer-term bull markets. Investors who sold during previous corrections, such as in 2020, 2011, or earlier, often regretted those decisions when gold resumed its upward trajectory.
Looking Ahead: What Could Trigger the Next Rally
While predicting exact timing is impossible, several potential catalysts could drive gold’s next significant move higher:
Federal Reserve Policy Shifts
If economic data weakens sufficiently to prompt the Federal Reserve to pivot back toward more aggressive rate cuts, gold could benefit significantly. Lower interest rates reduce the opportunity cost of holding non-yielding assets like gold and typically weaken the dollar, both of which support higher gold prices.
The market has already priced in some degree of monetary easing, but if economic conditions deteriorate more than expected, the Fed might be forced into more dramatic action, a scenario that would likely propel gold substantially higher.
Geopolitical Developments
Ongoing tensions in multiple global flashpoints, from Eastern Europe to the Middle East to Asia-Pacific, create an environment where gold’s safe-haven properties remain in demand. Any escalation of these conflicts typically drives investors toward defensive assets, with gold being a primary beneficiary.
Currency Market Volatility
Developments in currency markets, particularly any significant weakness in the U.S. dollar or concerns about other major currencies, could provide powerful tailwinds for gold. As analyzed in discussion of the dollar-gold relationship, these two assets often move in opposite directions.
Western Investment Flows
While Asian and emerging market buyers have driven much of gold’s recent strength, Western institutional investors remain underweight gold compared to historical norms. If concerns about stock market valuations, bond market losses, or economic slowdown intensify, a rotation of Western capital into gold could provide the next major catalyst for higher prices.
Conclusion: Correction as Opportunity
The gold market’s recent correction, while dramatic, represents a normal and healthy pause following an extraordinary rally. Far from signaling the end of gold’s bull market, this consolidation phase may be setting the foundation for the next leg higher.
The fundamental drivers supporting gold, inflation concerns, currency debasement worries, central bank demand, geopolitical uncertainty, and growing investment flows, remain firmly in place. The temporary nature of technical corrections, combined with these enduring structural supports, suggests that investors who maintain perspective and avoid emotional decision-making will be well-positioned for gold’s longer-term appreciation.
For those looking to build or expand precious metals positions, the current environment offers both lessons and opportunities. Volatility, while uncomfortable in the moment, creates the potential for attractive entry points. The key lies in focusing on fundamentals, maintaining appropriate time horizons, and remembering that successful investing rarely follows a straight line.
Whether you’re looking to take advantage of current market conditions or build strategic positions for long-term portfolio diversification, Bullion Trading LLC offers comprehensive precious metals solutions backed by market expertise and commitment to investor education. Our extensive inventory of gold, silver, platinum, and palladium products provides options across the spectrum from large institutional bars to popular retail coins, all supported by competitive pricing and reliable service.