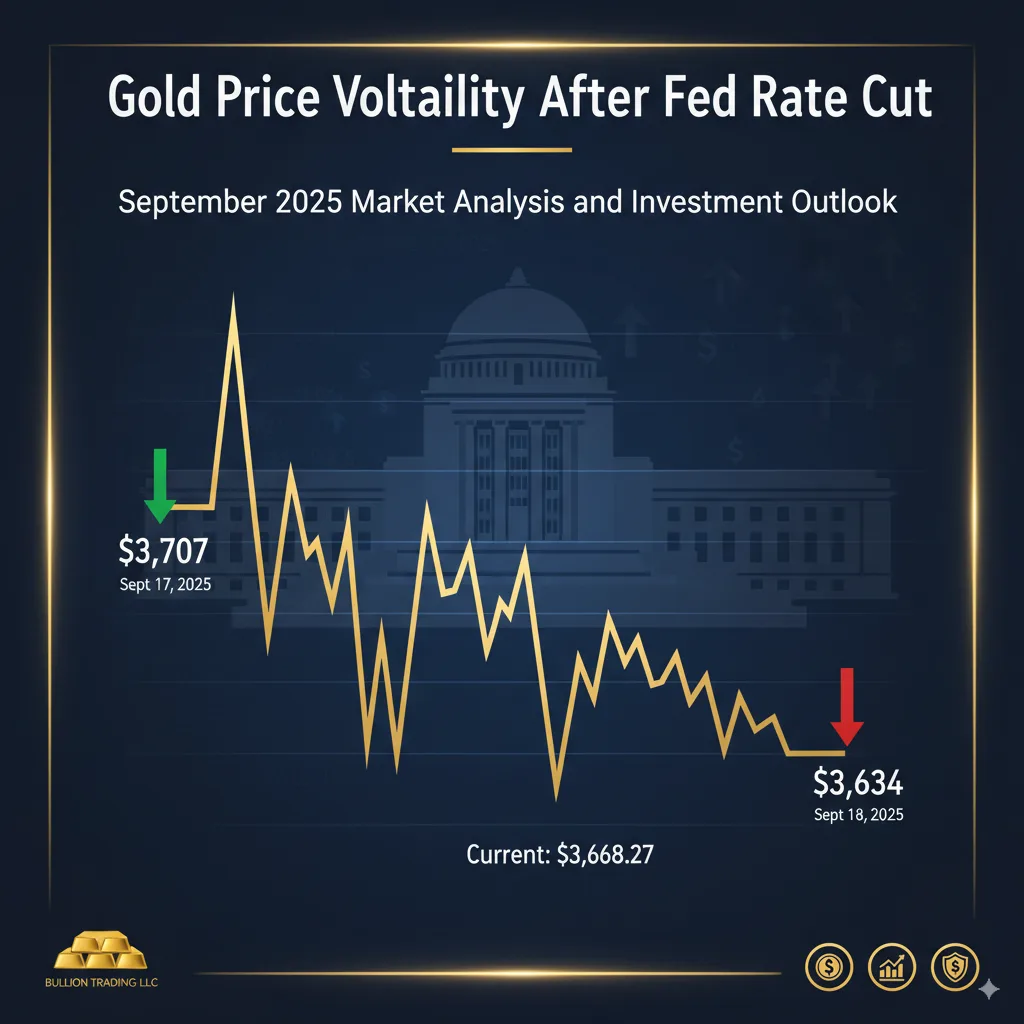
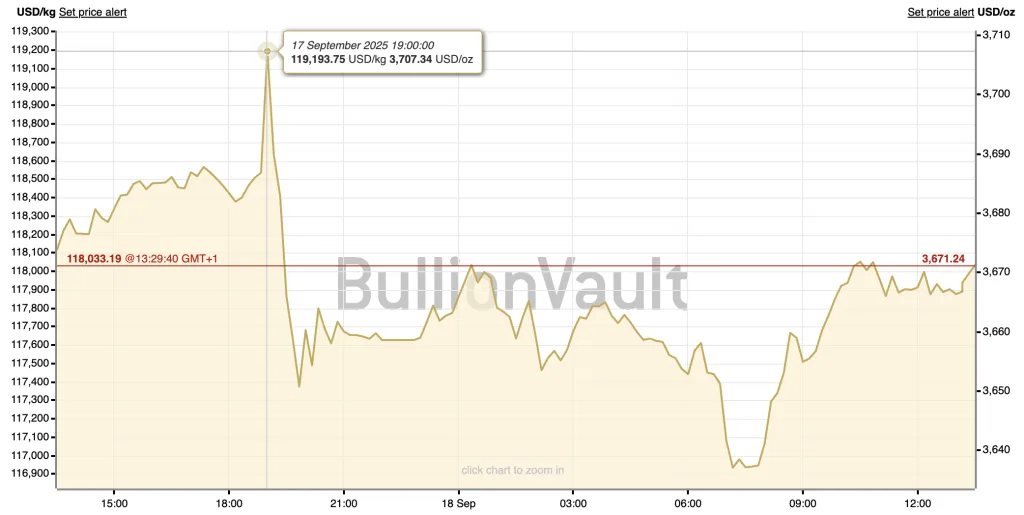
The precious metals market experienced dramatic volatility on September 17-18, 2025, as the Federal Reserve delivered its widely anticipated quarter-point interest rate cut, reducing the federal funds rate to a range of 4.00% to 4.25%. While gold initially surged to a remarkable $3,707 per ounce following the announcement, the celebration proved short-lived as both gold and silver reversed course in a dramatic display of market dynamics that left many investors reassessing their positions.
The Fed Decision: Setting the Stage for Volatility
The Federal Reserve cut interest rates for the first time in 2025, with the 25-basis-point reduction coming amid signs of a slowdown in the jobs market despite elevated inflation. This decision, while anticipated by markets with near certainty, triggered an immediate but ultimately unsustainable rally in precious metals.
Chair Jerome Powell’s characterization of the labor market as “softening” and his framing of the rate cut as a risk-management measure initially bolstered gold’s appeal. The Fed’s updated economic projections, commonly known as the “dot plot,” signaled two additional quarter-point cuts by year-end, aligning with market consensus but failing to provide the dovish surprise some gold bulls had hoped for.
Historic First: White House Presence at FOMC
The September 2025 FOMC meeting marked a historic precedent with White House economic adviser Stephen Miran’s confirmation to the Federal Reserve Board just days before the policy decision. Miran’s presence during the meeting represented the first time a sitting White House official participated in an FOMC policy discussion, raising questions about Federal Reserve independence that may have contributed to market uncertainty.
Gold’s Dramatic Reversal: From Record High to Reality Check
The initial euphoria that pushed gold to $3,707 per ounce quickly evaporated as market dynamics shifted. The current gold price as of 18.09.2025 is $3,668.27, down 0.05% from the previous day. This reversal from the intraday high represents a decline of approximately $73 per ounce, or nearly 2%, within hours of the Fed announcement.
Dollar Strength: The Unexpected Catalyst
Contrary to typical patterns, the U.S. dollar rallied from multi-year lows following the rate cut, creating headwinds for gold. The dollar index’s unexpected strength reduced gold’s attractiveness to international buyers and highlighted the complex relationship between monetary policy and currency markets in 2025’s unique economic environment.
The dollar’s resilience stemmed from several factors:
- Relative Policy Divergence: While the Fed cut rates, other major central banks face even more aggressive easing pressures
- Safe Haven Flows: Geopolitical uncertainties continue driving demand for dollar assets
- Fiscal Policy Expectations: Markets pricing in continued U.S. fiscal expansion supporting growth differentials
Silver’s Sharp Correction: From 14-Year Peak to Weekly Lows
Silver’s performance proved even more volatile than gold’s, with the white metal dropping toward one-week lows under $41.40 after briefly touching 14-year highs. Silver fell to 41.53 USD/t.oz on September 18, 2025, down 0.36% from the previous day. The sharp reversal erased recent momentum gains and highlighted silver’s enhanced sensitivity to both industrial demand concerns and speculative positioning.
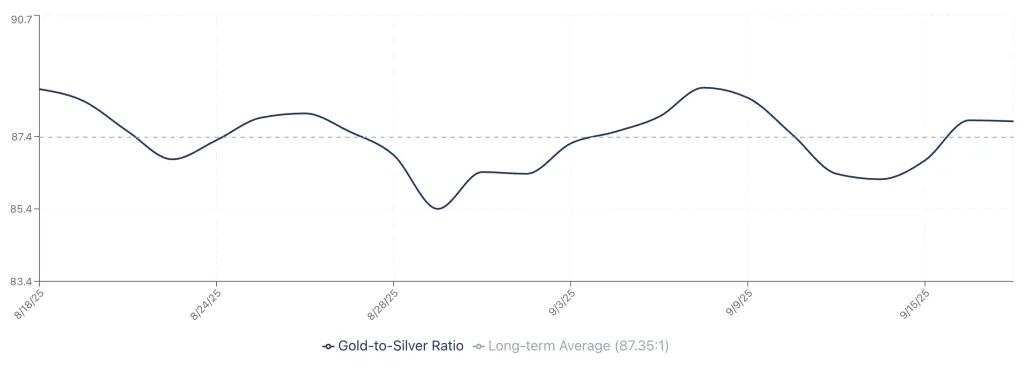
The Gold-Silver Ratio: Signaling Caution
The widening gold-silver ratio following the Fed decision suggests investors are favoring gold’s monetary characteristics over silver’s industrial applications. This divergence often signals broader concerns about global economic growth, particularly in manufacturing and technology sectors where silver demand remains critical.
Rising Yields: The Forgotten Headwind
Perhaps the most significant factor in gold’s reversal was the unexpected rise in long-term bond yields following the Fed cut. The 10-year Treasury yield’s increase reduced the relative attractiveness of non-yielding assets like gold, challenging the traditional inverse relationship between rates and precious metals prices.
This yield dynamics reflects several market concerns:
- Inflation Expectations: Despite the Fed cut, markets remain worried about persistent inflation pressures
- Term Premium Expansion: Investors demanding higher compensation for duration risk
- Fiscal Sustainability: Growing concerns about U.S. debt levels influencing long-term yields
Stephen Miran’s Dissent: A Dovish Voice in the Wilderness
Newly appointed Fed Governor Stephen Miran’s advocacy for a larger half-point cut diverged from the committee consensus, signaling potential future policy divisions. His dovish stance, while ultimately unsuccessful in swaying the immediate decision, may influence future deliberations as economic data evolves.
Miran’s arguments centered on:
- Preemptive Action: Need for more aggressive cuts to prevent economic slowdown
- Global Considerations: International weakness requiring stronger U.S. policy response
- Financial Stability: Concerns about credit market stress necessitating additional accommodation
Market Structure and Positioning: Understanding the Reversal
The rapid reversal in precious metals prices following initial gains reveals important market structure dynamics:
Leveraged Positioning Unwind
Speculative long positions built in anticipation of the Fed cut faced margin calls as prices reversed, accelerating the downward momentum. Commodity Futures Trading Commission data shows record speculative length in gold futures entering the Fed meeting, creating vulnerability to disappointment.
Options Market Dynamics
Heavy call option positioning at the $3,700 strike level created “gamma hedging” effects, where dealers selling protection were forced to sell gold as prices retreated from the strike level, amplifying the reversal.
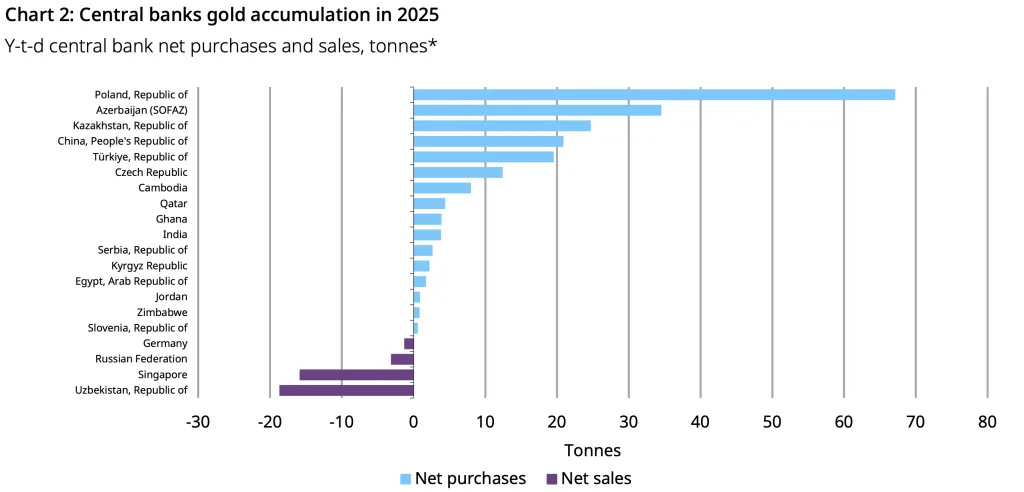
Central Bank Demand: The Structural Support Remains
Despite short-term volatility, central banks continue accumulating gold at near-record pace, providing fundamental support for prices. Year-to-date central bank purchases exceed 800 tonnes, on track for another record year following 2024’s historic buying.
Key central bank trends include:
- Emerging Market Leadership: China, India, Turkey leading purchases
- Reserve Diversification: Reducing dollar dependency in official reserves
- Geopolitical Hedging: Sanctions concerns driving physical gold accumulation
Technical Analysis: Key Levels and Market Structure
From a technical perspective, gold’s failure to hold above $3,700 creates important reference points for traders:
Support Levels
- Immediate Support: $3,620-3,634 (September 18 low)
- Major Support: $3,550-3,575 (August consolidation zone)
- Critical Support: $3,500 (psychological level and April 2025 breakout point)
Resistance Levels
- Near-term Resistance: $3,700-3,707 (September 17 high)
- Major Resistance: $3,750-3,800 (projected Fibonacci extensions)
- Long-term Target: $4,000 (psychological milestone)
Investment Implications: Navigating Volatility
The dramatic price action following the Fed decision offers several lessons for precious metals investors:
Portfolio Positioning Strategies
For Conservative Investors:
- Maintain core physical gold holdings for portfolio insurance
- Consider dollar-cost averaging during volatility
- Focus on allocated gold products for direct ownership
For Active Traders:
- Use volatility for tactical entry points
- Monitor gold-silver ratio for relative value opportunities
- Consider fractional gold products for flexibility
For Long-term Accumulators:
- View corrections as accumulation opportunities
- Diversify across gold, silver, and platinum
- Prioritize physical ownership over paper alternatives
Comparative Market Performance: Gold’s Relative Strength
Despite the post-Fed reversal, gold’s 2025 performance remains impressive:
| Asset Class | YTD Return |
| Gold | +41.4% |
| Silver | +35.0% |
| S&P 500 | +19.2% |
| 10-Year Treasury | -3.4% |
| US Dollar Index | -6.8% |
Data as of September 18, 2025
Fiscal Policy Wild Card: The Elephant in the Room
Analysts increasingly focus on fiscal rather than monetary policy as the primary driver for precious metals. With U.S. federal debt approaching unprecedented levels and deficit spending showing no signs of abating, gold’s role as a hedge against fiscal profligacy gains importance regardless of Fed policy nuances.
The fiscal backdrop includes:
- Record Deficits: FY2025 deficit projections exceeding $2 trillion
- Debt Ceiling Debates: Upcoming negotiations creating uncertainty
- Infrastructure Spending: Multi-year programs supporting commodity demand
Global Context: International Factors Supporting Gold
Beyond U.S.-centric factors, international developments continue supporting precious metals:
European Challenges
- ECB facing stagflation dilemma
- Energy crisis concerns persisting
- Banking sector stress in periphery nations
Asian Dynamics
- China’s economic rebalancing affecting commodity demand
- India’s record gold imports for festival season
- Japan’s yield curve control exit implications
Emerging Markets
- Currency crises driving local gold demand
- De-dollarization initiatives accelerating
- Resource nationalism affecting supply
Looking Ahead: Key Catalysts for Q4 2025
Several factors will likely determine gold’s trajectory through year-end:
Economic Data Points
- September employment report (October 4)
- Q3 GDP preliminary (October 30)
- November FOMC meeting (November 5-6)
Geopolitical Events
- U.S.-China trade negotiations
- Middle East tensions
- European energy security
Market Factors
- Dollar index direction
- Real interest rate trends
- Equity market volatility
Risk Management: Protecting Precious Metals Positions
Given heightened volatility, risk management becomes crucial:
Position Sizing
- Limit precious metals to 5-10% of total portfolio
- Diversify across gold, silver, and platinum
- Balance physical and paper exposures
Hedging Strategies
- Consider protective puts during rallies
- Use dollar-cost averaging for accumulation
- Maintain dry powder for corrections
Storage and Security
- Prioritize secure storage solutions
- Diversify storage locations
- Ensure proper insurance coverage
Conclusion: Volatility Creates Opportunity
While gold’s dramatic reversal from $3,707 to $3,634 following the Fed’s rate cut may disappoint short-term bulls, the fundamental case for precious metals allocation remains compelling. The combination of persistent inflation pressures, fiscal profligacy, geopolitical uncertainties, and central bank demand creates a supportive backdrop that transcends daily volatility.
Bank of America forecasts gold will hit $4,000 an ounce in 2026. Whether this ambitious target materializes depends on numerous factors, but the structural forces supporting precious metals appear firmly entrenched.
For investors seeking to capitalize on precious metals’ long-term potential while managing short-term volatility, Bullion Trading LLC offers comprehensive solutions. Our extensive inventory of gold bullion, silver products, and platinum offerings provides the physical assets needed to implement sophisticated portfolio strategies in this era of monetary transition.