Silver jumped to a fresh record high on December 1, 2025, touching $58.84 per ounce after surging nearly 6% in the previous session. The white metal has now climbed for six consecutive trading sessions and has nearly doubled in value this year, far outpacing gold’s impressive 60% rally. According to Bloomberg reporting via Yahoo Finance, traders are placing speculative bets on ongoing supply tightness that shows no signs of easing.
This isn’t mere speculation driving prices higher. The silver market has operated in structural deficit for seven consecutive years, with cumulative shortfalls totaling nearly 800 million ounces since 2021 according to Sprott’s Silver Investment Outlook. When supply persistently fails to meet demand year after year, something eventually breaks. In 2025, that something is price resistance.
The Supply Squeeze: What’s Actually Happening
A record amount of silver flowed into London in October 2025 to ease a historic squeeze in the world’s biggest trading hub for the metal. However, this relief came at a cost: other centers are now under pressure. According to Bloomberg’s December 1 report, inventories in warehouses linked to the Shanghai Futures Exchange recently hit the lowest in nearly a decade.
“Shortages in the global market as a result of the recent squeeze in London are still being felt,” said Daniel Hynes, a commodity strategist from ANZ Group Holdings Ltd. “With gold taking a breather, it appears investors have turned their attention to silver.”
It’s important to distinguish between two types of “tightness” in the silver market. As we explained in our lease rates analysis, some supply constraints are logistical, metal exists but isn’t in the right form or location for immediate delivery. These bottlenecks will ease as refiners catch up and supply chains adjust. However, the broader picture reveals a structural deficit that has persisted for seven consecutive years, suggesting something more fundamental than temporary logistics challenges.
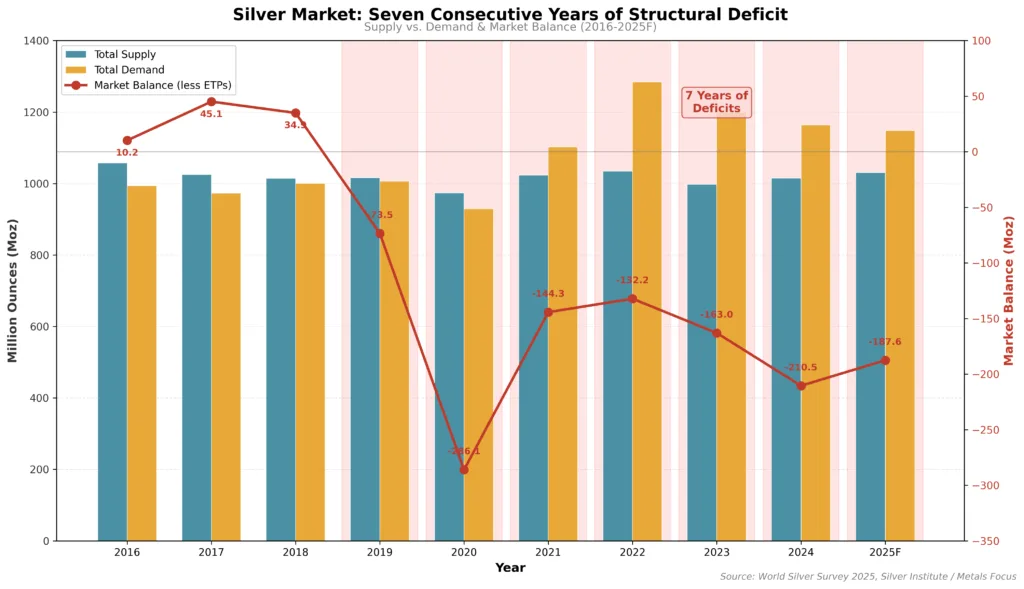
The cost of borrowing silver over one month remains elevated, reflecting persistent tightness in physically deliverable metal. As we examined in our analysis of gold and silver lease rates in 2025, some of this tightness reflects supply chain bottlenecks, refining capacity constraints, geographic mismatches, and form conversion delays, that will eventually ease. However, the underlying seven-year structural deficit represents something more fundamental than temporary logistics challenges.
Industrial Demand: The Structural Driver
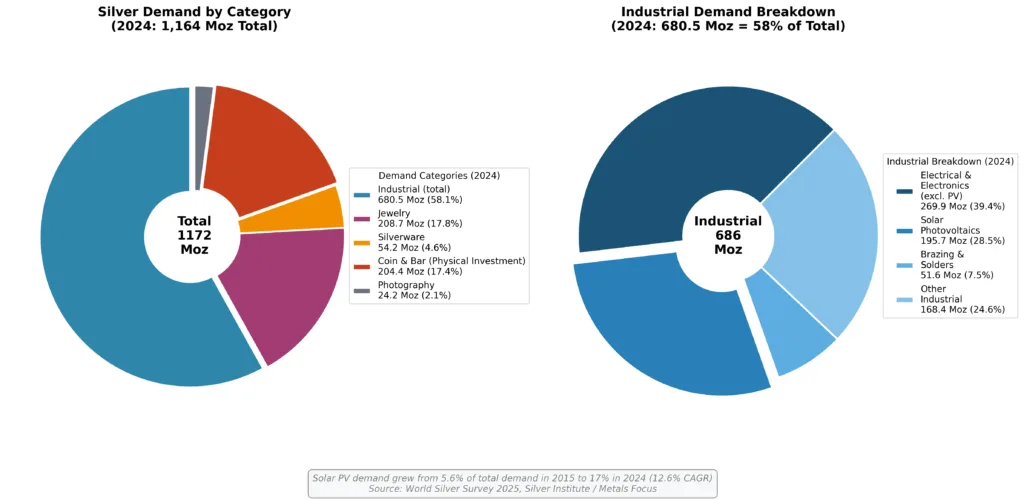
Silver isn’t just a monetary metal. It’s an industrial workhorse essential to the technologies powering our future. According to Sprott’s research, industrial demand accounts for 59% of silver usage, making it fundamentally different from gold in its demand profile.
The electrical and electronics sector has been the biggest demand driver, increasing 51% since 2016. This shouldn’t surprise anyone familiar with silver’s unique properties: it’s the most electrically conductive metal on Earth. The applications driving this demand include:
- Solar photovoltaics (PV): Solar-specific demand alone accounted for 17% of total silver demand in 2024, compared to just 5.6% in 2015, growing at an annualized rate of 12.6%. China increased its solar capacity by 45% in 2024.
- Electric vehicles: Rising vehicle sophistication and continued electrification of powertrains drive higher silver requirements per vehicle.
- Consumer electronics: Phones, tablets, wearables, and AI-related devices all require silver components.
- 5G networks: The global rollout of 5G infrastructure depends heavily on silver’s electrical conductivity.
This industrial demand is non-discretionary and price-inelastic in the short term. Manufacturers building solar panels or electric vehicles cannot simply pause production when metal becomes tight; they must secure supply regardless of cost. As detailed in Zacks’ analysis, silver’s industrial demand rose 4% in 2024 according to the Silver Institute, and the trend continues accelerating.
The Supply Side: Why Mining Can’t Keep Up
While demand surges, supply struggles to respond. Silver mine production has actually declined by 7% since 2016, according to Sprott data. Unlike gold, which is primarily mined as a primary product, approximately 70% of silver comes as a byproduct of mining other metals like copper, lead, and zinc. This means silver supply responds to the economics of those base metals rather than to silver’s own price.
The result: even as silver prices doubled in 2025, mining supply increased only modestly. The geological and economic constraints that limit supply growth ensure that demand increases translate more directly into price appreciation rather than supply expansion.
As we’ve analyzed in our examination of silver outpacing gold’s rally, this supply-demand dynamic creates conditions fundamentally different from typical commodity markets where high prices eventually stimulate sufficient supply to rebalance.
Investment Demand Compounds the Squeeze
Industrial demand alone would create significant upward pressure on prices. But investment demand has surged simultaneously, creating a perfect storm.
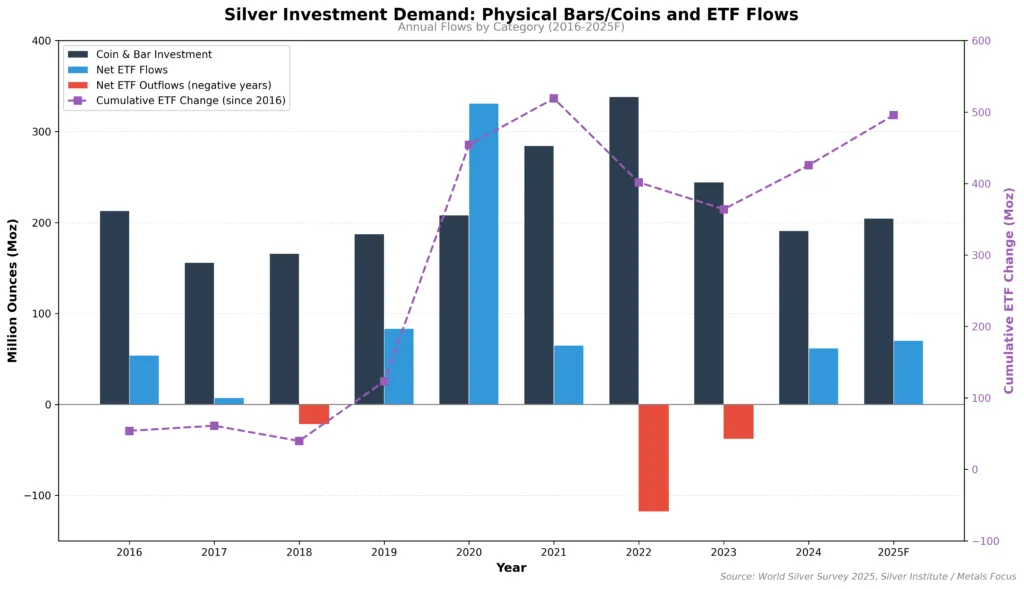
According to Investopedia reporting, Deutsche Bank expects exchange-traded funds’ silver holdings to hit a record high next year as rate cuts boost demand on Wall Street. The cost to lease silver rose to its highest since 2002 this year, indicating an extraordinary shortage. Deutsche Bank analysts predict that the supply of silver available for industrial use is currently its tightest on record.
In the first half of 2025 alone, global silver-backed ETPs experienced net inflows reaching 95 million ounces according to Sprott data. Since 2019, more than 1.1 billion ounces have been drawn from “available mobile inventory” to satisfy both industrial demand and ETP backing requirements. This represents metal that was readily accessible for lending or trading being locked into forms where it cannot easily re-enter the liquid market.
The Gold-Silver Ratio: A Signal of Undervaluation?
Silver remains undervalued relative to gold, potentially opening it to significant additional upside. On average, gold has historically been priced at 67 times the price of silver. With the current ratio at approximately 70-72, silver is selling at a meaningful discount to historical norms relative to gold.
“The move last week has been speculatively driven, with accelerating upside momentum attracting more and more fast money” said David Wilson, director of commodities strategy at BNP Paribas SA. “Key to watch is the fact that the gold-silver ratio has got down close to 70.”
In past precious metals bull markets, silver’s rally has averaged approximately twice as large as gold’s, according to Sprott’s historical analysis. This outperformance reflects silver’s smaller market size and higher volatility, which amplifies price movements, plus silver’s dual role as both monetary and industrial metal.
For deeper context on how these metals interact, our analysis of understanding the gold-silver ratio provides essential background for investors considering relative value opportunities.
The Tariff Wild Card
Traders are monitoring potential tariffs on silver after the precious metal was added to the U.S. Geological Survey list of critical minerals in November 2025. Fear of a sudden premium in America has made some traders hesitant about sending metal out of the country, offering little prospect of relief should the global market tighten further.
As we examined in our analysis of tariffs and precious metals investment, trade policy uncertainty creates additional layers of complexity for supply chains already under stress. The potential for tariffs adds another bullish catalyst to an already supportive fundamental picture.
Federal Reserve Policy: The Interest Rate Factor
Both silver and gold have been boosted by increased expectations that the Federal Reserve will cut interest rates in December 2025. According to the CME FedWatch Tool, markets fully priced in a quarter-point rate cut on continued weakness in the American labor market.
Lower interest rates typically benefit non-yielding precious metals by reducing the opportunity cost of holding them versus interest-bearing assets. As we detailed in our examination of Fed rate cut expectations and gold prices, this dynamic supports both gold and silver, though silver’s additional industrial demand drivers give it extra momentum.
Silver call options volatility jumped to the highest premium over puts since 2022, indicating a surge in the cost of betting on higher prices. This options market signal suggests professional traders are positioning for continued upside.
What This Means for Investors
The convergence of seven years of supply deficits, surging industrial demand, record investment flows, and supportive monetary policy creates conditions unlike anything the silver market has seen in decades. Deutsche Bank forecasts silver prices will average about $55 an ounce next year, though current spot prices already exceed that level.
Key Considerations for Silver Investors
Distinguish structural deficits from logistics bottlenecks: Not all “tightness” is created equal. Refining backlogs and geographic mismatches will eventually normalize, but seven years of demand exceeding supply represents a structural imbalance that high prices alone cannot quickly resolve given silver’s byproduct nature.
Supply constraints are structural, not purely cyclical: Unlike most commodities where high prices stimulate supply increases, silver’s byproduct nature limits supply response. This suggests elevated prices may persist longer than typical commodity cycles, even after logistics bottlenecks ease.
Industrial demand is non-discretionary: Solar panel manufacturers, EV producers, and electronics companies cannot easily substitute away from silver. They must secure supply regardless of price in the short term.
Investment demand creates feedback loops: As investors accumulate silver in ETFs and physical forms, they reduce available supply for industrial users, intensifying the squeeze and supporting further price appreciation.
Physical ownership eliminates counterparty risk: During periods of genuine supply tightness, physical silver in coins and bars provides direct ownership without reliance on any institution’s ability to deliver metal.
Conclusion: Supply Constraints Meet Structural Demand
Silver’s surge to record highs above $58 per ounce reflects fundamental supply-demand dynamics that have been building for seven years. This isn’t purely speculative froth or momentum trading divorced from reality, though as we’ve noted in our lease rates analysis, some near-term tightness stems from logistics bottlenecks that will eventually ease.
The critical distinction for investors: temporary supply chain constraints (refining backlogs, geographic mismatches) differ from structural deficits (demand persistently exceeding supply for seven consecutive years). The former will normalize; the latter suggests a more fundamental imbalance that supports the long-term investment case for silver.
Industrial demand continues accelerating as the world electrifies. Investment demand compounds pressure as institutions and individuals seek hard assets amid monetary uncertainty. Supply remains constrained by silver’s unique production dynamics as a mining byproduct, a structural factor that won’t change regardless of how efficiently refiners operate.
Whether silver prices continue rising depends on multiple factors: Federal Reserve policy, industrial demand growth, investment flows, and potential supply responses. But the structural picture favors continued tightness. Markets in persistent deficit eventually experience price discovery that clears the imbalance.
Whether you’re establishing initial precious metals positions or expanding existing holdings, Bullion Trading LLC offers comprehensive silver and gold products backed by market expertise and commitment to investor education. From popular sovereign coins like American Silver Eagles to larger bars for substantial positions, our extensive inventory serves every investment strategy. In a market where supply tightness creates genuine scarcity of deliverable metal, physical ownership ensures you hold the actual asset rather than a promise to deliver.