
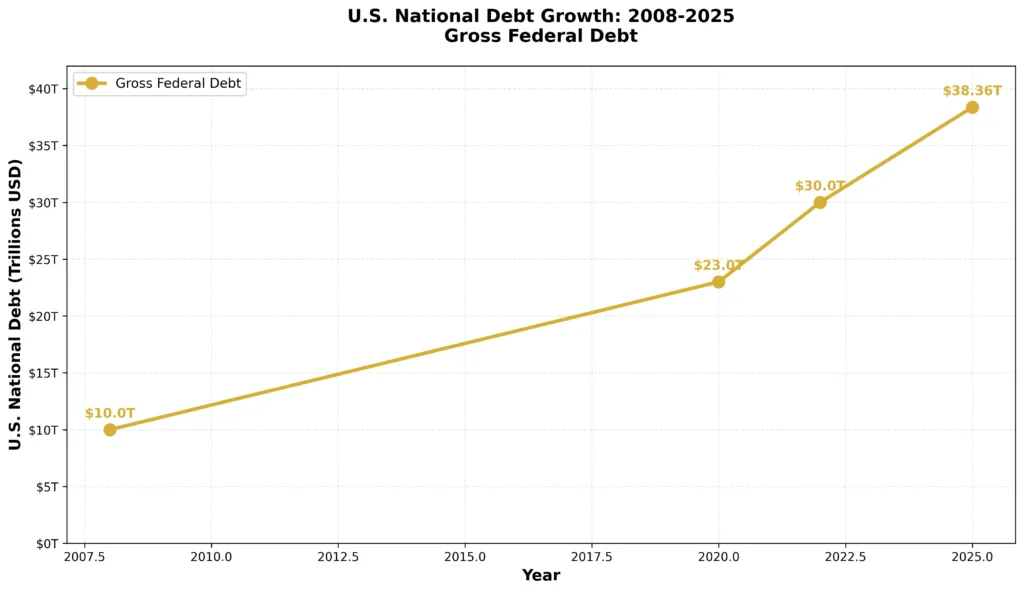
The U.S. national debt surged past $38 trillion in November 2025, according to U.S. Debt Clock and U.S. Treasury Department data, marking an acceleration that should alarm every investor. Debt burdens are large, but the exact debt-to-GDP percentage depends on which debt measure is used: gross federal debt (the Treasury headline, currently ~$38.36T) is roughly in the 120–125% range on common real-time measures, while “debt held by the public” (about $30.4T according to RAND’s November 2025 analysis) is closer to ~100% of GDP. This article specifies which measure is cited in each section so readers can judge the scope for themselves. Yet markets remain eerily complacent, pricing in orderly debt management scenarios that history suggests are dangerously optimistic.
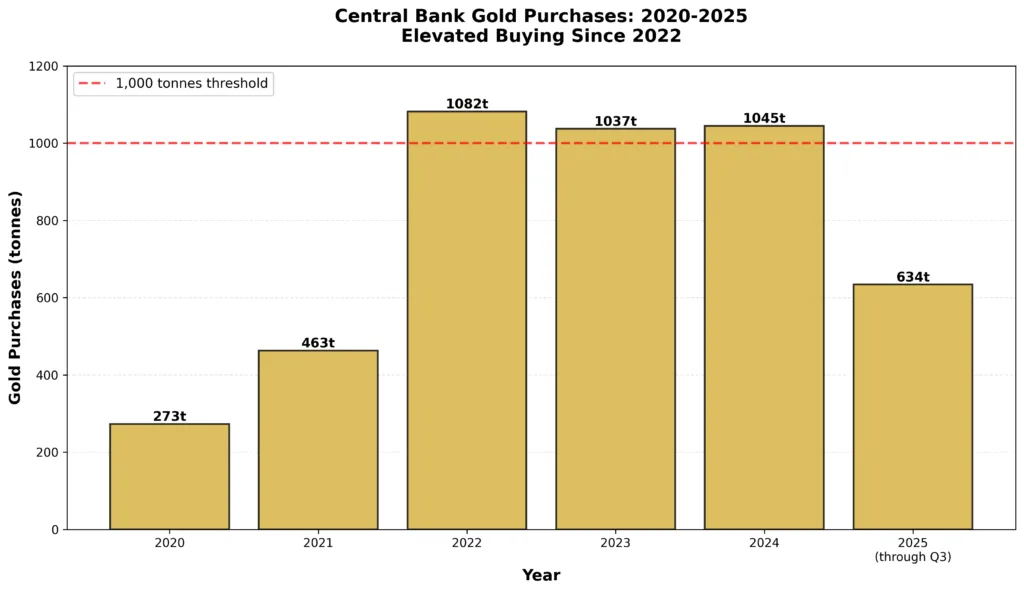
Gold’s response tells a different story. The precious metal reached record highs above $4,000 per ounce in late 2025, with central banks purchasing 634 tonnes through Q3 2025 according to World Gold Council data. When the world’s most sophisticated monetary authorities accumulate gold aggressively amid exploding debt levels, they’re signaling concerns that extend far beyond typical business cycle risks.
Understanding why $38 trillion in government debt creates conditions that favor gold requires examining not just the numbers themselves, but the structural impossibility of managing this debt burden through conventional means. The math doesn’t work. The political will doesn’t exist. History demonstrates that when sovereign debt reaches these levels, the resolution inevitably involves currency debasement, exactly the environment where gold has consistently protected wealth.
The Debt Trajectory: $38 Trillion and Accelerating
From Crisis Response to Structural Problem
The federal debt stood at approximately $10 trillion in 2008 before the financial crisis. By 2020, it had nearly doubled to $23 trillion. The COVID-19 pandemic added another $7 trillion in just two years, pushing debt above $30 trillion by 2022. Now, in November 2025, we’ve surged past $38 trillion, with Congressional Budget Office projections and other fiscal analysts suggesting the trajectory remains unsustainable under many plausible policy scenarios.
Which debt metric matters? Analysts commonly distinguish between (a) gross federal debt (the Treasury headline figure, currently ~$38.36T), (b) debt held by the public (roughly ~$30.4T), and (c) various net-debt measures that subtract intragovernmental claims. RAND’s November 2025 commentary highlights this nuance, noting the $38T headline is “about equal to the size of the U.S. economy” under gross measures, while debt held by the public is closer to about 100% of GDP. Because these definitions materially affect interpretation, this article specifies which measure it references in each section.
This acceleration reveals a fundamental shift. Post-2008 spending began as crisis response, but it became structurally embedded in government operations. Programs expanded, entitlements grew, and political constituencies organized around maintaining spending levels. Reversing this trajectory would require politically difficult choices that neither party shows willingness to make.
Interest Payments: The Vicious Cycle
Annual interest payments on federal debt are large and rising. Recent authoritative estimates put annual interest costs in the range of $1.0–1.2 trillion (for example, RAND’s November 2025 commentary cites roughly $1.1 trillion based on FRED data). Exact figures vary by source and methodology, gross vs. net interest, cash vs. accrual accounting, and timing differences can shift the reported number, so readers should expect small discrepancies between authoritative sources. Regardless, interest costs are among the fastest-growing budget categories and, if rates or outstanding debt continue to rise, can materially constrain fiscal choices.
The mathematics create a vicious cycle. Higher interest rates increase borrowing costs. Rising debt levels require increased borrowing. Together, these dynamics compound exponentially. Even assuming rates remain at current levels around 4-5%, the Committee for a Responsible Federal Budget projects interest costs will exceed $1.5 trillion annually by 2027.
This debt service burden consumes resources that might otherwise fund productive investment, creating a direct drag on economic growth. Lower growth weakens tax revenue, which increases deficits, which accelerates debt accumulation. The feedback loop intensifies with each passing year.
Why Conventional Solutions Won’t Work
The Political Impossibility of Austerity
Theoretical solutions to excessive debt involve spending cuts, tax increases, or economic growth sufficient to outpace debt accumulation. The political economy of modern democracy makes the first two options nearly impossible to implement at the necessary scale.
Cutting spending meaningfully requires addressing entitlement programs, Social Security, Medicare, Medicaid, which comprise approximately 50% of federal spending according to Office of Management and Budget data. These programs enjoy powerful political constituencies that have successfully resisted reform for decades. Defense spending, another 15% of the budget, faces similar political protection.
Tax increases sufficient to close trillion-dollar deficits would require rates so high they’d likely trigger economic contraction, reducing revenue despite higher rates. The Laffer Curve suggests diminishing returns from tax increases beyond certain thresholds, particularly for mobile capital and high earners.
Growth Won’t Solve the Problem
Some analysts argue robust economic growth can reduce debt-to-GDP ratios by expanding the denominator. Historical precedent undermines this optimism. Post-World War II debt reduction occurred during America’s singular period of global economic dominance, with demographics, productivity growth, and geopolitical conditions that cannot be replicated.
Current U.S. demographics feature an aging population, declining labor force participation, and mounting dependency ratios that constrain growth potential. The Bureau of Labor Statistics projects labor force growth will average just 0.4% annually through 2030, far below levels needed to support debt reduction through growth.
Moreover, as examined in our analysis of AI job displacement effects, technological change threatens to disrupt traditional employment faster than new jobs emerge, creating structural unemployment that weighs on tax revenue while increasing transfer payment demands.
Historical Precedent: Sovereign Debt Crises and Gold
The 1940s Playbook: Financial Repression
The United States last carried debt exceeding 100% of GDP following World War II. The resolution employed “financial repression”: holding interest rates below inflation rates through Federal Reserve intervention, creating negative real yields that eroded debt’s real value over time.
This approach worked because:
- Inflation averaged 4-6% while Treasury yields were capped at 2.5%
- Capital controls prevented money from fleeing to international markets
- Strong post-war economic growth supported real GDP expansion
- Political consensus existed for shared sacrifice
Replicating this strategy today faces significant obstacles. Capital is globally mobile, making capital controls nearly impossible to enforce. Economic growth prospects are weaker. Most importantly, wealth holders have alternatives in 2025 that didn’t exist in 1945, including gold, which is accessible to everyone through products like those available at Bullion Trading LLC.
The 1970s Stagflation: Uncontrolled Debasement
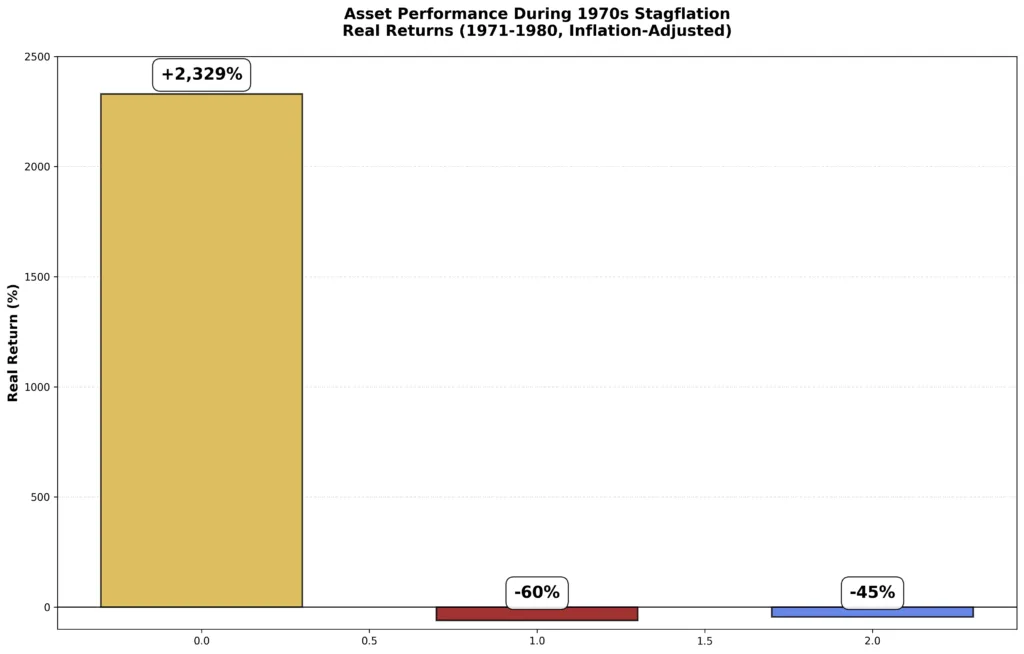
When financial repression loses control, as occurred in the 1970s, inflation accelerates beyond manageable levels. Consumer price inflation exceeded 13% in 1980 according to Bureau of Labor Statistics data, destroying purchasing power while government debt remained elevated relative to GDP.
Gold’s performance during this period proved spectacular. From $35 per ounce in 1971 when the gold standard ended, to over $850 by January 1980, gold delivered returns exceeding 2,300% while stocks delivered essentially zero real returns and bonds suffered devastating losses as rising interest rates crushed principal values.
The pattern emerges clearly: when sovereign debt reaches unsustainable levels and conventional solutions prove politically or economically impossible, governments consistently choose the path of currency debasement over default or austerity.
Why Central Banks Are Accumulating Gold
Record Purchases Amid Record Prices
Central bank gold purchases reached 634 tonnes through Q3 2025 according to World Gold Council preliminary data, maintaining the elevated pace seen since 2022. This represents the third consecutive year of purchases exceeding 1,000 tonnes annually, unprecedented in the modern era.
The significance lies not in the absolute numbers, but in the price environment where this accumulation occurs. Central banks are paying record prices above $4,000 per ounce to acquire gold, demonstrating that their motivation extends beyond tactical trading or cost minimization. As detailed in our Q3 2025 demand analysis, these institutions possess the longest time horizons and best available data about monetary system stability.
Diversification from Dollar Dependence
The World Gold Council’s Central Bank Gold Reserves survey identifies currency diversification, inflation concerns, and geopolitical risk as primary motivations for official sector gold accumulation. These concerns directly relate to government debt dynamics.
When central banks hold U.S. Treasury securities, they face dual risk: interest rate risk (rising rates reduce bond values) and currency risk (dollar devaluation reduces purchasing power). Physical gold stored in domestic vaults eliminates both risks while providing a neutral reserve asset with no counterparty exposure.
The acceleration in central bank buying beginning in 2022 coincides precisely with the period when U.S. debt crossed $30 trillion and interest rate volatility increased dramatically. The correlation suggests these sophisticated reserve managers view current debt trajectories as sufficiently concerning to warrant significant portfolio rebalancing.
The Policy Box: Why the Fed Can’t Escape
Scenario 1: Higher Rates Accelerate Crisis
If the Federal Reserve maintains elevated interest rates to combat inflation, debt service costs accelerate toward $2 trillion annually. This creates several cascading problems:
First, rising interest payments directly increase the deficit, requiring more borrowing, which increases debt, which increases future interest costs. The feedback loop becomes self-reinforcing.
Second, higher rates increase borrowing costs throughout the economy, weakening growth and reducing tax revenue. Lower revenue combined with higher spending creates explosive deficit growth.
Third, as analyzed in our examination of Fed liquidity stress and banking system strain, sustained high rates eventually threaten financial system stability by stressing over-leveraged borrowers and creating funding market disruptions.
This scenario ultimately forces Fed intervention through balance sheet expansion and rate cuts, both of which debase the currency and support gold prices.
Scenario 2: Lower Rates Enable Inflation
If the Fed cuts rates aggressively to reduce debt service burdens and support economic growth, inflation concerns reemerge. With U.S. household debt reaching $18.59 trillion as of Q3 2025, consumer spending capacity remains constrained. Lower rates combined with continued deficit spending risk reigniting inflation without generating sustainable growth.
Moreover, lower rates reduce the attractiveness of Treasury securities to foreign buyers. China and Japan, historically the largest foreign holders of U.S. debt, have reduced their holdings in recent years according to Treasury International Capital data. If foreign demand declines further, the Fed must effectively monetize more debt through bond purchases, a textbook recipe for currency debasement.
This scenario also leads to gold appreciation as real yields (nominal yields minus inflation) remain negative or compressed, reducing the opportunity cost of holding non-yielding assets like gold.
The Impossible Choice
Both scenarios, maintaining high rates or cutting aggressively, lead to outcomes supportive of gold prices. This “policy box” creates asymmetric risk/reward for precious metals investors. The scenarios that truly damage gold, sustained deflation or real yield expansion, get prevented by Fed intervention long before they fully develop. Meanwhile, the scenarios favoring gold, inflation or currency debasement, become increasingly likely as debt burdens compound.
Why Gold Provides Optimal Defense
Zero Counterparty Risk
Physical gold ownership carries zero counterparty risk. Unlike government bonds, corporate debt, or even bank deposits, physical gold maintains value independent of any institution’s solvency or government’s fiscal capacity. When sovereign debt reaches levels that create concerns about long-term Treasury security, this characteristic becomes invaluable.
As detailed in our analysis of JP Morgan’s tokenized dollar versus physical gold, even technologically sophisticated digital alternatives to traditional banking cannot replicate gold’s fundamental independence from institutional continuity.
Fixed Supply Economics
Gold’s supply increases approximately 1.5% annually through mining, a rate constrained by geological limitations and unable to accelerate regardless of price. This contrasts sharply with government debt, which can expand in unlimited quantities through legislation and central bank accommodation.
Total U.S. debt, combining federal, state, local, household, and corporate obligations, exceeds $90 trillion. This represents claims on future production that far exceed the economy’s capacity to deliver, creating fundamental mismatch between claims and real resources. Resolution requires either default (explicitly impossible for reserve currency) or inflation (reducing real value of claims through currency debasement).
Gold’s fixed supply ensures it benefits from this resolution mechanism. As debt-to-GDP ratios climb and central banks monetize increasing portions of government borrowing, each dollar’s purchasing power declines relative to gold’s constrained supply.
Portfolio Insurance During Correlated Declines
World Gold Council research demonstrates that gold’s correlation with stocks and bonds decreases precisely when diversification matters most. During sovereign debt crises, equities face pressure from economic weakness while bonds suffer from rising rates and inflation concerns. Gold typically appreciates in this environment, providing ballast when traditional portfolio components decline simultaneously.
This uncorrelated behavior becomes particularly valuable given current market conditions. Stock market valuations approach historic extremes, with the CAPE ratio reaching 39.51 in October 2025, levels that historically preceded poor forward returns. When equity corrections coincide with sovereign debt concerns, gold’s historical tendency to appreciate during such episodes offers essential portfolio protection.
Investment Demand Confirms the Thesis
Institutional Accumulation Accelerates
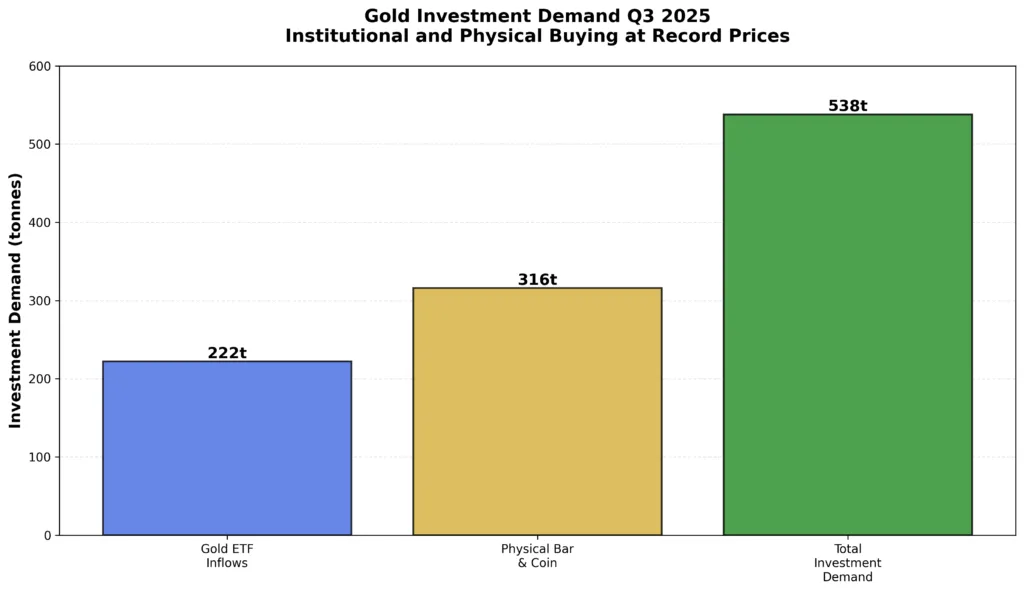
Gold-backed ETFs experienced inflows of 222 tonnes in Q3 2025, representing a 134% increase from Q3 2024’s 95 tonnes according to World Gold Council data. Year-to-date through Q3, gold ETFs attracted 619 tonnes of inflows, with September 2025 recording $17 billion, the largest monthly inflow ever.
These flows represent institutional capital, pension funds, endowments, sovereign wealth funds, making strategic allocation decisions. When sophisticated investors with multi-decade time horizons reverse years of outflows to accumulate gold at record prices, it signals fundamental reassessment of monetary and fiscal stability.
Physical Demand Remains Robust
Physical bar and coin demand totaled 316 tonnes in Q3 2025, marking the fourth consecutive quarter above 300 tonnes. This consistency at elevated price levels demonstrates that sophisticated individuals and high-net-worth investors maintain conviction despite gold trading above $4,000 per ounce.
The divergence between institutional accumulation and retail sentiment reveals typical market dynamics. When sophisticated buyers with superior information and longer time horizons buy aggressively, retail investors often hesitate because “prices are too high.” This pattern has characterized successful long-term investments throughout market history.
Strategic Implementation for Investors
Physical Gold: Core Holdings
Physical gold in coins and bars provides direct ownership with zero counterparty risk. Popular sovereign coins like American Gold Eagles, Canadian Gold Maples, or Austrian Philharmonics offer high liquidity and government backing. Larger bars provide lower premiums for substantial positions.
The choice between coins and bars depends on individual circumstances, but the common thread is physical possession or allocated storage where specific bars remain designated to your ownership. This eliminates the intermediation risk that characterizes ETFs or other financial gold exposure.
Systematic Accumulation
Dollar-cost averaging removes timing considerations while ensuring consistent exposure. Making regular purchases captures both market strength and weakness, reducing impact of short-term volatility while building positions aligned with the structural driver: unsustainable government debt trajectories that ultimately require currency debasement.
As examined in our analysis of gold bull market corrections, temporary price weakness during ongoing bull markets creates optimal accumulation opportunities for investors with long-term perspectives.
Allocation Considerations
Traditional guidance suggests 5-15% precious metals allocation for most investors, though specific circumstances vary. Current conditions, with gross federal debt exceeding $38 trillion and debt held by the public around 100% of GDP, plus central banks accumulating aggressively might warrant positions toward the higher end of this range for some investors.
Position sizing should account for volatility tolerance. Gold can experience 10-20% corrections during structural bull markets. Sizing positions such that these moves don’t force liquidation at inopportune times separates successful gold investors from those who sell at precisely the wrong moment.
Complementary Silver Exposure
Silver provides leverage to gold moves while offering additional industrial demand drivers. As detailed in our analysis of the gold-silver ratio, relative value opportunities emerge between the metals that tactical investors can exploit while maintaining core precious metals exposure.
Conclusion: Preparing for Debt Crisis Resolution
The U.S. national debt surging past $38 trillion in November 2025 represents more than a statistical milestone. It signals the approaching endgame of a multi-decade debt accumulation cycle that began in earnest after 2008 and accelerated dramatically during the pandemic response.
History provides clear precedent for how sovereign debt crises at this scale resolve. Governments consistently choose currency debasement over default or austerity, particularly when debt is denominated in their own currency. The political economy of modern democracy makes spending cuts politically impossible, while economic constraints limit growth-based solutions. This leaves inflation and financial repression as the path of least resistance.
Central banks worldwide recognize this dynamic, which explains their aggressive gold accumulation at record prices. These institutions with multi-decade time horizons and access to the best available data are making a collective statement about the long-term trajectory of fiat currencies amid unsustainable debt dynamics.
For individual investors, the implications are clear. Traditional portfolio approaches based on stocks and bonds face unprecedented risks from the combination of elevated equity valuations, compressed bond yields, and mounting sovereign debt concerns. Gold’s role as a non-correlated asset with zero counterparty risk becomes essential rather than optional in this environment.
The question isn’t whether $38 trillion in debt creates problems, it’s how those problems ultimately resolve. When central banks signal through their actions, sustained aggressive gold accumulation, that they understand the likely resolution mechanism, individual investors should pay attention.Whether you’re establishing initial precious metals positions or expanding existing holdings, Bullion Trading LLC offers comprehensive gold and silver products backed by market expertise and commitment to investor education. From popular sovereign coins to large institutional bars, our extensive inventory serves every investment strategy. In an economy where government debt has reached levels historically associated with monetary instability, gold ensures your wealth remains protected regardless of how the debt crisis ultimately resolves.