
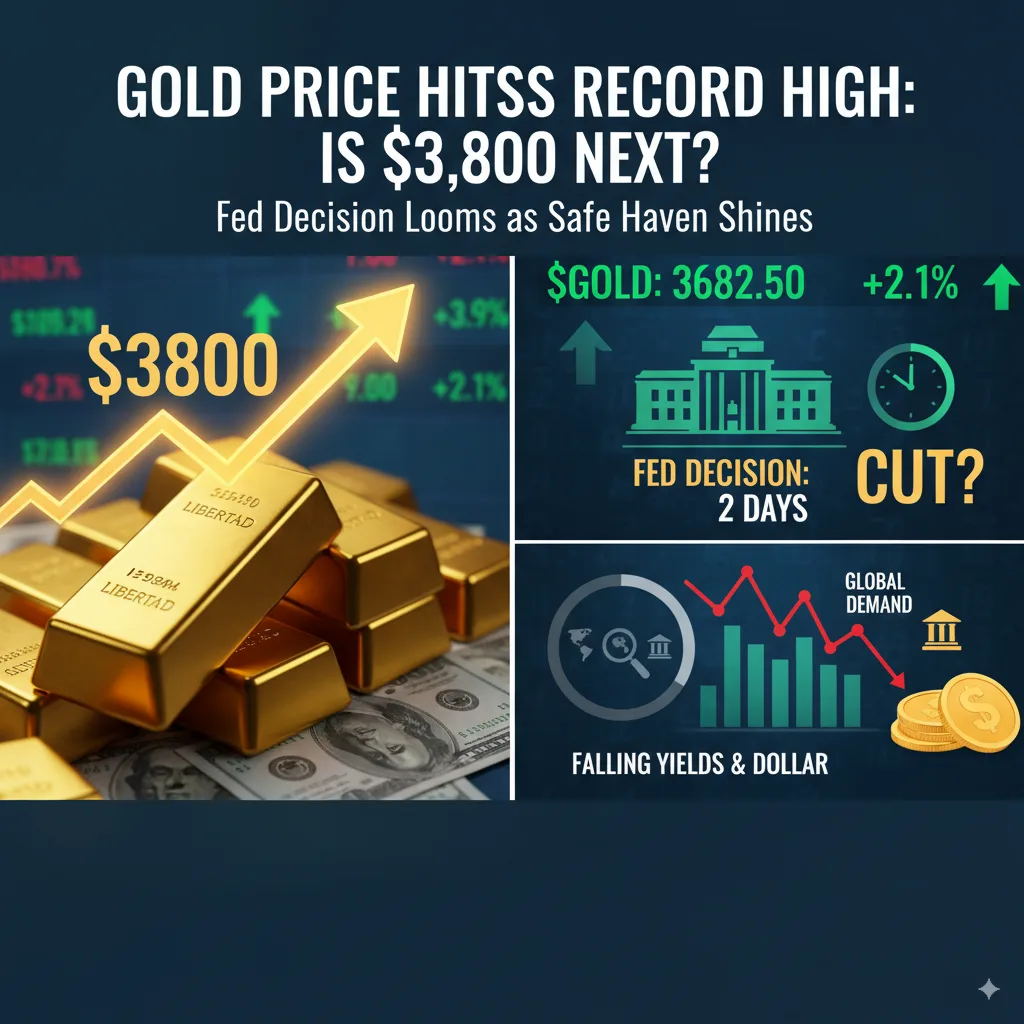
Update, 21 October 2026: This analysis was written in September 2025; its prices, figures and outlook are as of that date. On 3 November 2026 the gold Ask was $3,966 an ounce and silver $50.07, 27% and 58% below the records both set on 29 January 2026. For the record and the crash that followed, see gold price in 2026.
Gold has once again proven its reputation as the ultimate safe haven. On September 15, 2025, spot gold soared past $3,680 per ounce, setting a fresh all-time high. Futures climbed in tandem, with markets eyeing the $3,700 milestone.
The timing couldn’t be more critical: the Federal Reserve’s September policy meeting is just days away, and expectations of a rate cut are fueling demand for the yellow metal. As Treasury yields slide and the U.S. dollar weakens, investors are piling into gold, betting on further upside in the months ahead.
This rally isn’t happening in isolation. It reflects shifting macroeconomic forces, global demand patterns and technical momentum that some analysts said could carry gold toward $3,800 or higher by year-end.

The Big Picture: Why Gold Is Shining Now
Gold’s surge is being powered by a perfect storm of catalysts:
1. Fed Policy Expectations
For months, traders have speculated about when the Fed would begin cutting rates. Now, consensus is building around at least a 25-basis-point cut in September, with some models even suggesting a 50-point move.
Rate cuts reduce the opportunity cost of holding gold, since gold doesn’t pay interest. This makes bullion more attractive relative to bonds and other fixed-income assets.
2. Weak U.S. Dollar
The U.S. dollar index fell to a one-week low, making gold cheaper for foreign buyers. Since gold is priced in dollars, any dollar weakness tends to amplify upward moves in gold.
This trend may persist if the Fed signals multiple cuts for the rest of 2025.

3. Falling Treasury Yields
The 10-year U.S. Treasury yield has been sliding, reflecting market expectations of easier monetary conditions. Lower yields reduce competition for gold, pushing investors toward the metal as both a hedge and a growth play.
4. Safe-Haven Demand
From uneven inflation patterns to geopolitical tensions in Asia and Europe, investors are once again reminded that gold serves as an anchor in uncertain times. Central banks, particularly in Asia and the Middle East, have also been steadily buying gold, supporting the market’s floor.
Technical Outlook: Gold’s Next Moves
Technical analysts saw the breakout above $3,680 as significant, describing a bullish trend heading into the Fed meeting.
Levels Technical Analysts Cited (September 2025):
| Price Level | Technical Significance |
| $3,700 | Immediate resistance & psychological barrier |
| $3,730-$3,745 | Next resistance cited if the breakout held |
| $3,800+ | Longer-term level cited by bullish analysts |
| $3,600 | First support on pullbacks |
| $3,500 | Deeper support |
Risks That Could Trigger a Pullback
Analysts also flagged potential headwinds:
- Hawkish Fed Surprise: If the Fed cuts but signals concern over inflation, markets may temper expectations for further easing. That could strengthen the dollar and pressure gold.
- Stronger U.S. Data: A hot inflation print or strong jobs report could cause yields to rise again.
- Profit Taking: After a historic run, some investors may lock in gains, leading to short-term volatility.
- Central Bank Activity: If central banks slow their gold purchases, demand could soften.
Global Factors Supporting Gold Demand
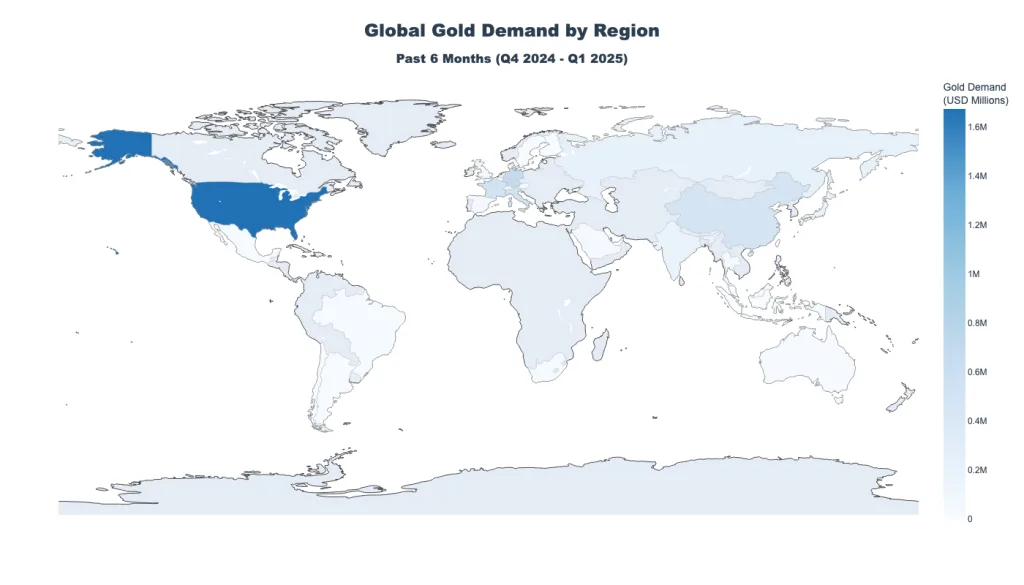
It’s not just the U.S. driving gold higher. Global developments are adding fuel to the rally:
- India: As the world’s largest consumer of gold, India is entering its festive season. Seasonal jewelry demand often provides a floor for global prices.
- China: With its currency under pressure, Chinese investors are buying gold as a hedge against yuan weakness.
- Europe: Economic stagnation and ongoing uncertainty over energy security are boosting European appetite for gold ETFs and bullion.
- Central Banks: From the People’s Bank of China to Middle Eastern sovereign wealth funds, official gold purchases remain a major tailwind.
How Investors Approached Gold in September 2025
Commentary at the time described several common approaches:
1. Physical Gold
Physical gold held directly carries no counterparty risk, which is why many holders see it as a hedge. Its price can still swing sharply.
2. Buying on Dips
Some long-term holders prefer to buy after pullbacks rather than at new highs; in September 2025 analysts pointed to $3,600 as the first support level. Waiting for a dip can also mean missing a rally: gold passed $4,000 in October 2025.
3. ETFs and Mining Stocks
ETFs and gold mining stocks trade on exchanges and are easy to buy and sell. Mining stocks in particular tend to move more than the gold price, in both directions, and carry company risk.
4. Time Horizon
Analysts who expected several Fed cuts into 2026 saw room for gold to rise above $4,000.
Historical Context: Gold’s Journey to $3,680
To appreciate today’s rally, it’s worth remembering gold’s trajectory:
- 2020 Pandemic: After falling in the March sell-off, gold rose above $2,070 in August 2020.
- 2022-23 Tightening Cycle: Aggressive Fed hikes pushed yields higher, capping gold around $1,900-$2,000.
- 2024 Breakout: As inflation moderated and central banks bought aggressively, gold broke $2,500.
- 2025 Surge: Now, at nearly $3,700, gold is in uncharted territory, with Fed easing as the latest catalyst.
This journey underscores gold’s dual role: protection in crises and growth in monetary easing cycles.
Conclusion: A Record Ahead of the Fed
Gold’s breakout above $3,680 signals more than just a new record. It reflects a changing global financial landscape, one where central banks are pivoting, currencies are under strain, and investors are seeking timeless security.
Technical analysts’ near-term levels were $3,700-$3,745, and many expected the Fed’s rate cuts to support further gains toward $3,800 by year-end.
Bullion Trading LLC sells physical gold, silver and platinum online and at its New York store. This article describes the market in September 2025; it is not investment advice.